SOUTH32 Limited Elliott Wave technical forecast [Video]
![SOUTH32 Limited Elliott Wave technical forecast [Video]](https://editorial.fxstreet.com/images/Markets/Equities/Industries/CommunicationServices/cable-network-man-637435389675652273_XtraLarge.jpg)
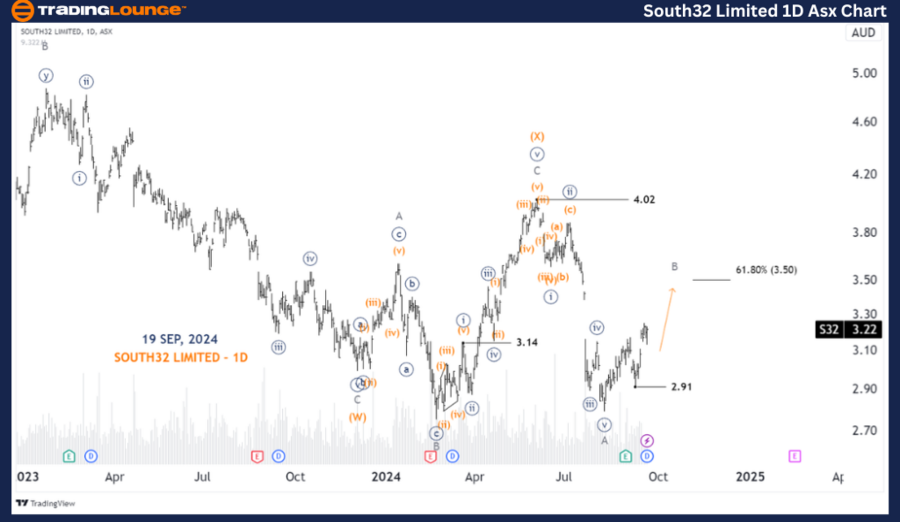
ASX: SOUTH32 LIMITED – S32 Elliott Elliott Wave Technical Analysis TradingLounge (1D Chart).
Greetings, Our Elliott Wave analysis today updates the Australian Stock Exchange (ASX) SOUTH32 LIMITED – S32. We see S32 continuing to push lower with (Y)-orange wave.
ASX: SOUTH32 imited– S32 One-day chart (semilog scale) analysis
Function: Counter trend (Minor degree, grey).
Mode: Corrective.
Structure: Double Zigzag.
Position: Wave B-grey of Wave (Y)-orange.
Details: Since the high at 4.02 wave (Y)-orange is unfolding as a zigzag. Wave A-grey has completed, and wave B-grey is unfolding to push higher, targeting around the high at 3.50. After wave B-grey is completed, wave C-grey could return to push lower. While price must remain below the high at 4.02 to maintain this view.
Invalidation point: 4.02.
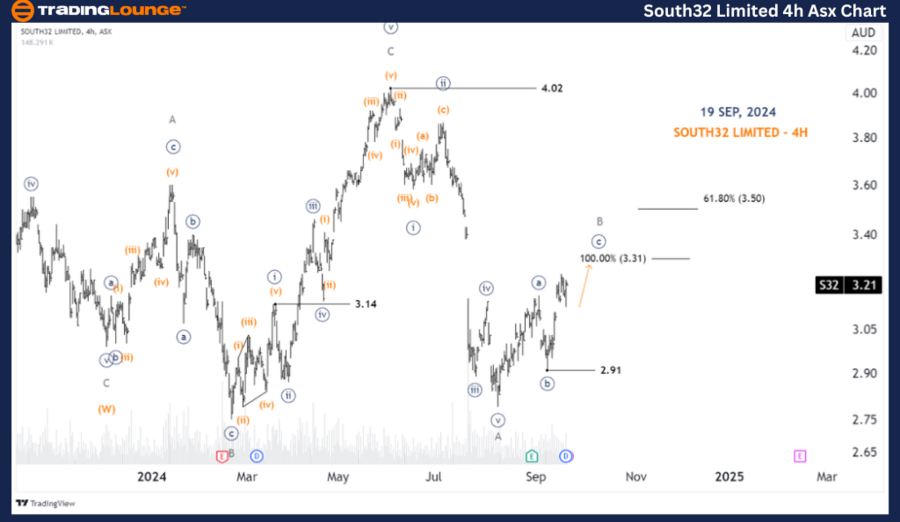
ASX: SOUTH32 Limited – Four-hour chart analysis
Function: Counter Trend (Minor degree, grey).
Mode: Corrective.
Structure: Zigzag.
Position: Wave ©-navy of Wave B-grey.
Details: The shorter 4H chart, shows that the B-grey wave is unfolding to push higher, which itself is developing as a Zigzag, labeled ((a)),((b)),((c))-navy. Basically the ((c))-navy wave is almost done, it can continue to push higher, aiming for the nearest target at 3.31, breaking through this level will continue towards the target around 3.50. While price must always stay above 2.91 to maintain this view.
Invalidation point: 4.02.
Conclusion
Our analysis, forecast of contextual trends, and short-term outlook for ASX: SOUTH32 LIMITED – S32 aim to provide readers with insights into the current market trends and how to capitalize on them effectively. We offer specific price points that act as validation or invalidation signals for our wave count, enhancing the confidence in our perspective. By combining these factors, we strive to offer readers the most objective and professional perspective on market trends.
SOUTH32 Limited Elliott Wave technical forecast [Video]
Author

Peter Mathers
TradingLounge
Peter Mathers started actively trading in 1982. He began his career at Hoei and Shoin, a Japanese futures trading company.


