South32 Limited Elliott Wave technical forecast [Video]
![South32 Limited Elliott Wave technical forecast [Video]](https://editorial.fxstreet.com/images/Markets/Equities/Industries/Materials/extracting_mine_materials2_XtraLarge.jpg)
ASX: S32 Elliott Wave technical analysis
Our Elliott Wave analysis today updates the Australian Stock Exchange (ASX) SOUTH32 LIMITED – S32. We observe S32 continuing its downward movement. Our focus will be on identifying a Long Trade Setup as wave 2-gray unfolds as an ABC Correction.
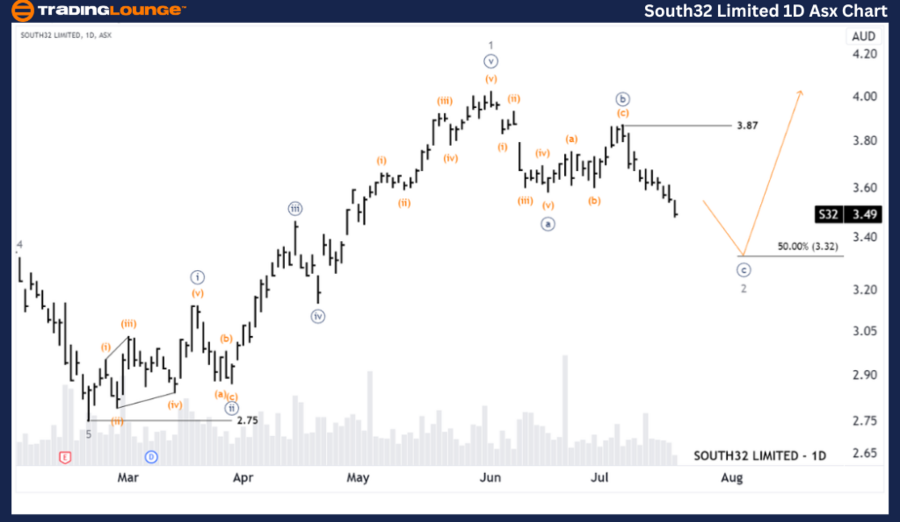
ASX: S32 Elliott Wave technical analysis – One-day chart
-
Function: Major trend (Minor degree, gray).
-
Mode: Motive.
-
Structure: Impulse.
-
Position: Wave ((c))-navy of Wave 2-gray.
-
Details: Wave ((c))-navy of wave 2-gray is expected to push lower, potentially finding support around the 3.32 level. The price must stay below the 3.87 high to maintain this view.
-
Invalidation point: 2.75.
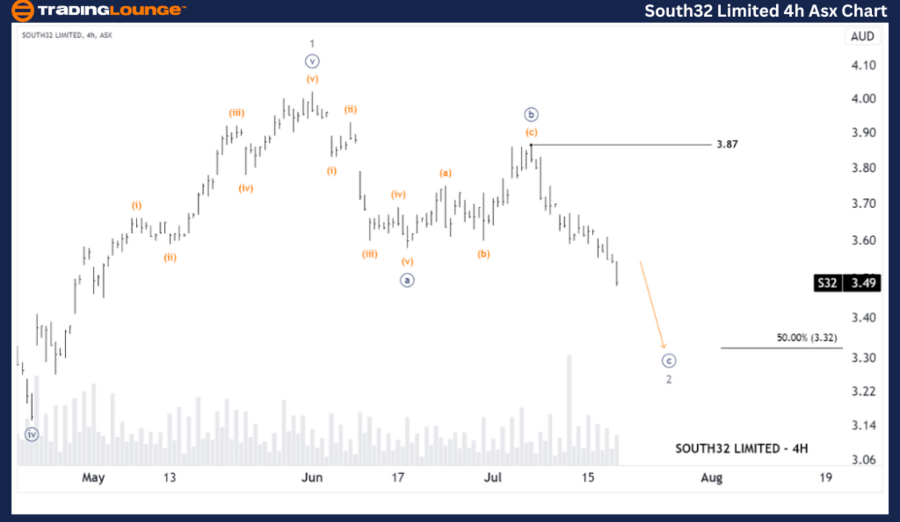
ASX: S32 Elliott Wave technical analysis – four-hour chart
-
Function: Major Trend (Minor degree, gray).
-
Mode: Motive.
-
Structure: Impulse.
-
Position: Wave (i)-orange of Wave ((c))-navy of Wave 2-gray.
-
Details: Wave ((c))-navy is developing as a Zigzag and is expected to drop slightly lower before wave (iii)-orange completes. The target for wave 2-gray is a low of 3.32.
-
Invalidation point: 3.87.
Conclusion
Our analysis, forecast of contextual trends, and short-term outlook for ASX: SOUTH32 LIMITED – S32 aim to provide insights into current market trends and how to capitalize on them effectively. We offer specific price points that act as validation or invalidation signals for our wave count, enhancing confidence in our perspective. By combining these factors, we strive to offer readers the most objective and professional perspective on market trends.
South32 Limited Elliott Wave technical forecast [Video]
Author

Peter Mathers
TradingLounge
Peter Mathers started actively trading in 1982. He began his career at Hoei and Shoin, a Japanese futures trading company.


