South32 Limited Elliott Wave technical analysis [Video]
![South32 Limited Elliott Wave technical analysis [Video]](https://editorial.fxstreet.com/images/TechnicalAnalysis/ChartPatterns/Candlesticks/stock-market-graph-and-bar-chart-price-display-75053099_XtraLarge.jpg)
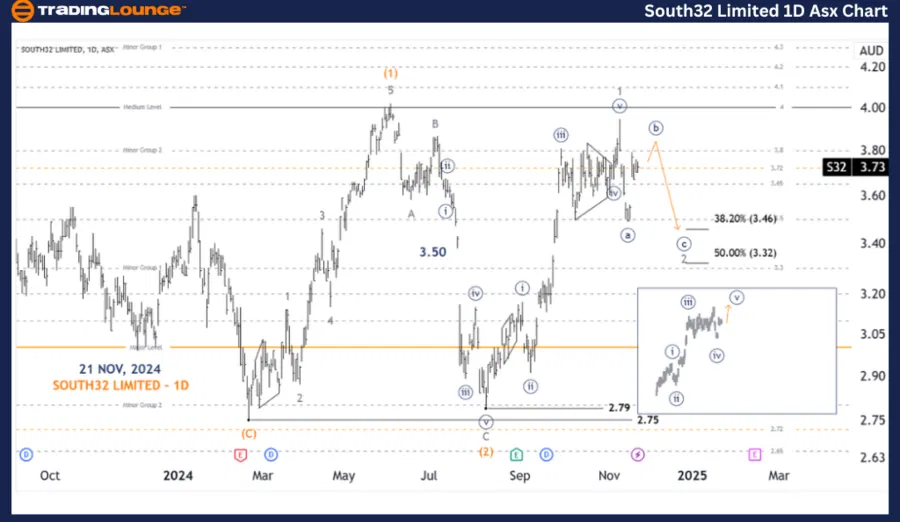
ASX: S32 Elliott Wave technical analysis
Greetings, Our Elliott Wave analysis today updates the Australian Stock Exchange (ASX) SOUTH32 LIMITED – S32. We see ASX:S32 likely to have a pullback in the near future with wave 2-grey, before wave 3-grey pushes much higher.
ASX: S32 one-day chart (semilog scale) analysis
Function: Major trend (Minor degree, gray).
Mode: Motive.
Structure: Impulse.
Position: Wave ((a))-navy of Wave 2-grey.
Details: Wave 1-grey is probably complete, and wave 2-grey could continue pushing down further, aiming for retracement targets around 3.46 - 3.32. Then wave 3-grey could return to push higher. If price continues to push up instead of pushing down, it could suggest an alternative scenario, in which wave ((v))-navy is unfolding. But the end result would still be a push lower with wave 2-grey.
Invalidation point: 2.79.
ASX: S32 four-hour chart analysis
Function: Major trend (Minor degree, grey).
Mode: Motive.
Structure: Diagonal.
Position: Wave ((b))-navy of Wave 2-grey.
Details: There is no change on the 4H chart compared to the 1D chart. But the price pushing above 3.95 would indicate that the ((v))-navy wave of the 1-grey wave is active under the ALT replacement scenario. And it will probably complete soon at that point, and a pullback with the 2-grey wave would be the final outcome.
Invalidation point: 2.79.

Conclusion
Our analysis, forecast of contextual trends, and short-term outlook for ASX: SOUTH32 LIMITED – S32 aim to provide readers with insights into the current market trends and how to capitalize on them effectively. We offer specific price points that act as validation or invalidation signals for our wave count, enhancing the confidence in our perspective. By combining these factors, we strive to offer readers the most objective and professional perspective on market trends.
South32 Limited Elliott Wave technical analysis [Video]
Author

Peter Mathers
TradingLounge
Peter Mathers started actively trading in 1982. He began his career at Hoei and Shoin, a Japanese futures trading company.


