|

Sony is near to end a leading diagonal and it could start a pullback

Sony Group Corporation, commonly known as SONY, is a Japanese multinational conglomerate corporation. As a major technology company, it operates as one of the world’s largest manufacturers of consumer and professional electronic products, the largest video game console company.

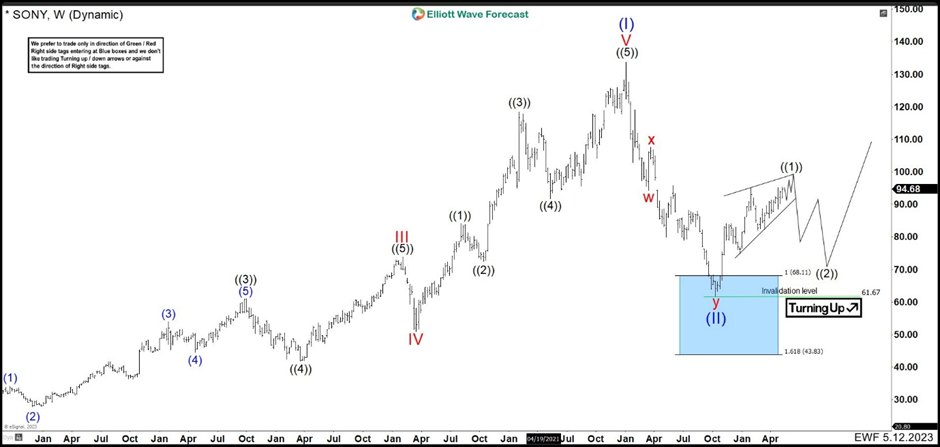
SONY ended an impulse that began at the end of 2012. The share price reached 133.75 in January 2021, that is, 9 years of upward movement. We called this impulse wave (I). The price started to fall forming a double correction and after almost 5 months wave II ended.

Sony weekly chart November 27 th 2022

Chart

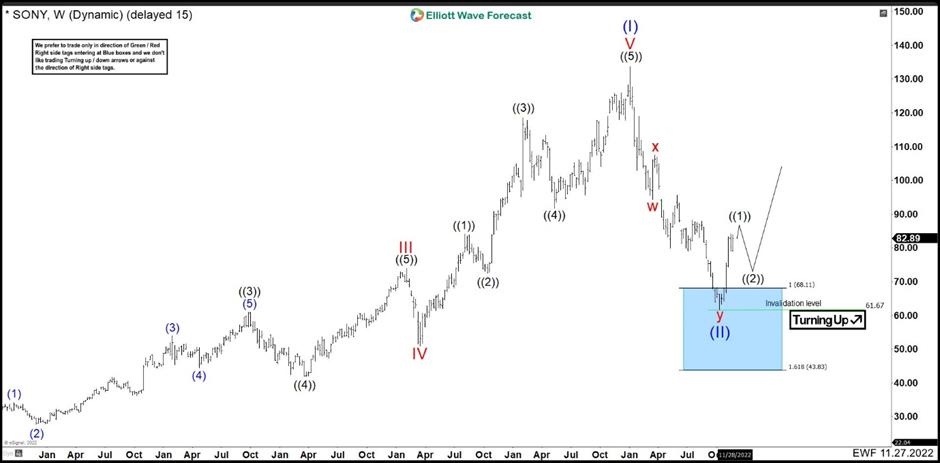
This is SONY last November chart. The first 3 swings ended wave w at 94.40. Connector wave x finished at 107.79. Down from wave x market made 3 swings lower to complete y. Wave (a) ended at 80.05 and bounced as wave (b) ended at 95.96. Last drop as wave (c) made an impulse to the blue box area ending wave y and wave (II) at 61.67. The rally began and it should continue higher until stock price stays above 61.67.

Sony weekly chart May 12 th 2023

Chart

Author

Elliott Wave Forecast Team

Elliott Wave Forecast Team

ElliottWave-Forecast.com

More from Elliott Wave Forecast Team
Share:

Editor's Picks

EUR/USD flirts with daily highs, retargets 1.1900

EUR/USD regains upside traction, returning to the 1.1880 zone and refocusing its attention to the key 1.1900 barrier. The pair’s slight gains comes against the backdrop of a humble decline in the US Dollar as investors continue to assess the latest US CPI readings and the potential Fed’s rate path.

GBP/USD remains well bid around 1.3650

GBP/USD maintains its upside momentum in place, hovering around daily highs near 1.3650 and setting aside part of the recent three-day drop. Cable’s improved sentiment comes on the back of the Greenback’s  irresolute price action, while recent hawkish comments from the BoE’s Pill also collaborate with the uptick.

Gold clings to gains just above $5,000/oz

Gold is reclaiming part of the ground lost on Wednesday’s marked decline, as bargain-hunters keep piling up and lifting prices past the key $5,000 per troy ounce. The precious metal’s move higher is also underpinned by the slight pullback in the US Dollar and declining US Treasury yields across the curve.

Crypto Today: Bitcoin, Ethereum, XRP in choppy price action, weighed down by falling institutional interest 

Bitcoin's upside remains largely constrained amid weak technicals and declining institutional interest. Ethereum trades sideways above $1,900 support with the upside capped below $2,000 amid ETF outflows.

Week ahead – Data blitz, Fed Minutes and RBNZ decision in the spotlight

US GDP and PCE inflation are main highlights, plus the Fed minutes. UK and Japan have busy calendars too with focus on CPI. Flash PMIs for February will also be doing the rounds. RBNZ meets, is unlikely to follow RBA’s hawkish path.

Ripple Price Forecast: XRP potential bottom could be in sight

Ripple edges up above the intraday low of $1.35 at the time of writing on Friday amid mixed price actions across the crypto market. The remittance token failed to hold support at $1.40 the previous day, reflecting risk-off sentiment amid a decline in retail and institutional sentiment.