![]() Barry Weinstein
Barry Weinstein
Volatility Markets Newswire
Introduction
VolatilityMarkets suggests top quant trade ideas to take advantage of trending markets.
Market summary
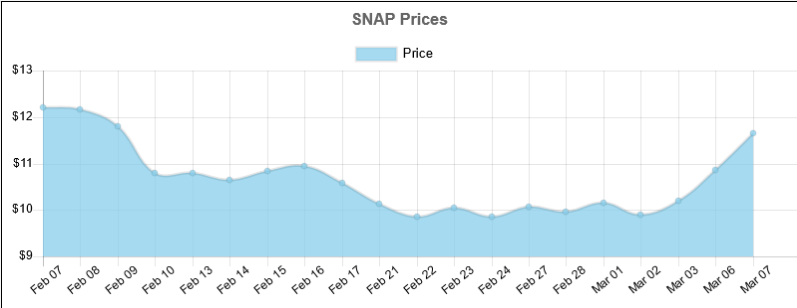
Price
SNAP last price was $ 11.66.
Trend analysis
In the short term Snapchat has been accelerating higher. In the long term Snapchat has been accelerating lower.
Value analysis
Over the past 19 days, the SNAP price increased 9 days and decreased 10 days. For every up day, there were 1.11 down days. The average return on days where the price increased is 2.8601% The average return on days where the price decreased is -2.9079%
Performance
Over the past 19 Days, the price has decreased by -4.5% percent. Over the past 19 days, the average return per day has been -0.2368% percent.
Trade idea
With the short term trend being the stronger of the two, we propose a long trade idea with an overnight time horizon.
The trade idea
Buy $ 65,983 USD of Snapchat, take profit at $ 11.9636 level with 24.99% odds for a $ 1,718 USD gain, stop out at $ 11.4833 with 50.0% odds for a $ 1,000 USD loss through O/N time horizon.
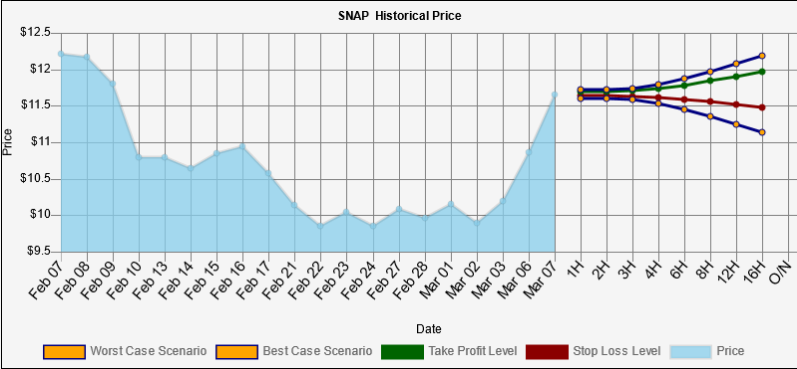
Intraday predictions
SNAP trend analysis
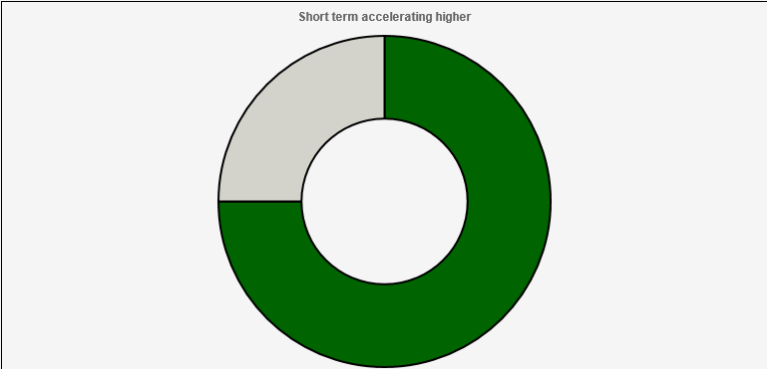
SNAP last price was $ 11.66. The short term trend accelerating higher is stronger than the long term trend accelerating lower. This trade goes long when the last change was higher and accelerating.
SNAP value analysis
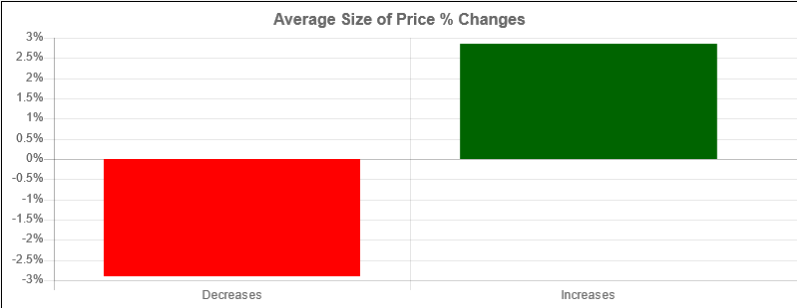
Over the past 19 days, the SNAP price increased 9 days and decreased 10 days. For every up day, there were 1.11 down days. The average return on days where the price increased is 2.8601% The average return on days where the price decreased is -2.9079% Over the past 19 Days, the price has decreased by -4.5% percent. Over the past 19 days, the average return per day has been -0.2368% percent.
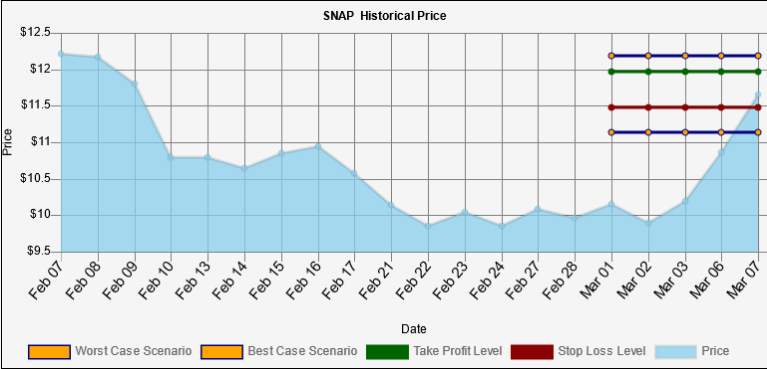
SNAP worst/best case scenario analysis
Within 1 week, our worst case scenario where we are 95% certain that this level won't trade for SNAP, is $ 11.1369 , and the best case scenario overnight is $ 12.1831 . levels outside of this range are unlikely, but still possible, to trade. We are 50% confident that $ 11.4833 could trade and that $ 11.9636 could trade. These levels are within statistical probability.
Expected range
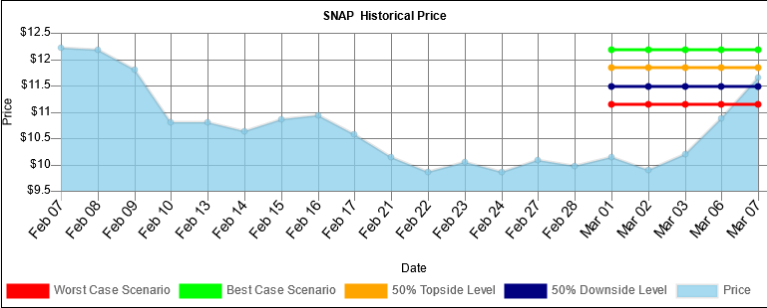
Within 1 week, our worst case scenario where we are 95% certain that this level won't trade for SNAP, is $ 11.1369 , and the best case scenario overnight is $ 12.1831 . levels outside of this range are unlikely, but still possible, to trade. We are 50% confident that $ 11.4833 could trade and that $ 11.9636 could trade. These levels are within statistical probability.
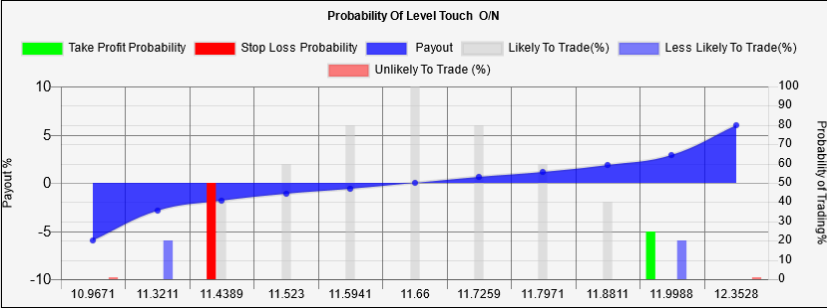
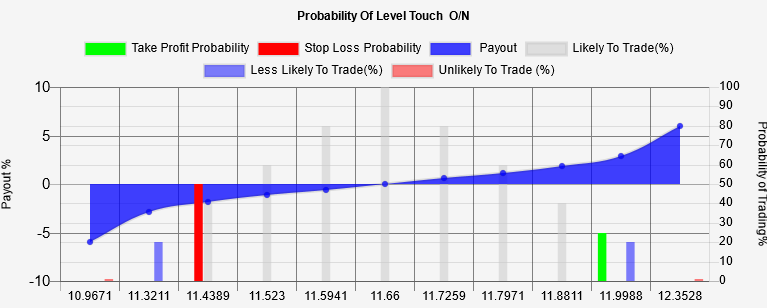
Probability Vs Payout Chart:
This graph contrasts the percentage payout of holding a position vs the probability that the payout occurs. The red and green columns represent the probability of stopping out and taking profit and their associated payouts.
Key Takeaways:
-
Price today $ 11.66
-
Over the past 19 days, the SNAP price increased 9 days and decreased 10 Days.
-
For every up day, there were 1.11 down days.
-
The average return on days where the price increased is 2.8601%.
-
The average return on days where the price decreased is -2.9079%.
-
Over the past 19 Days, the price has decreased by -4.5% percent.
-
Over the past 19 days, the average return per day has been -0.2368% percent.
-
Over the past 19 days, The price has on average been accelerating: $ 0.0417 per day lower.
-
Over the last session, the price increased by $ 0.79.
-
Over the last session, the price increased by 6.7753 %.
-
Over the last session, the price accelerated by $ 0.11.
Volatility Markets provides trend following trade ideas for momentum traders. The Volatility Markets Newswire measures the direction and acceleration of a security and then structures a trade idea to capitalize on the trend. While trends have been shown to exist in markets over the past 100 years, they are no guarantee of future asset prices. You should take these ideas lightly and at your own risk.
Recommended content
Editors’ Picks

EUR/USD retreats from YTD peaks on USD recovery
The mild rebound in the US Dollar is prompting EUR/USD to give back part of its earlier advance—after reaching new 2025 highs around 1.0560—and retreat toward the 1.0520 area, although it still posts decent gains for the day.

GBP/USD clings to daily gains just above 1.2700
Following an initial climb to three-month highs around 1.2750, GBP/USD is now losing some of its upward momentum due to a tepid bounce in the Greenback, while market participants prepare for President Trump's upcoming address to Congress.

Gold retains the $2,900 level amid risk aversion
Further US tariffs and retaliatory measures from countries maintain the trade war narrative well in place, with Gold prices advancing to four-day tops past the $2,920 mark per troy ounce on Tuesday

Cryptomarket falls as US Crypto Strategic Reserve hype fizzles into classic ‘buy the rumor, sell the news’
Bitcoin, Ethereum, Solana, Ripple and Cardano continue their declines for the second consecutive day after their recent upsurge on Sunday. US President Trump’s announcement of the Crypto Strategic Reserve was turned into a short-term “buy the rumor, sell the news” event.

Tariffs, Ukraine and Oil dominate
The US imposed 25% tariffs on Canada and Mexico starting from today, it also imposed another 10% on China. The US also confirmed that it would suspend all military aid to Ukraine.

The Best brokers to trade EUR/USD
SPONSORED Discover the top brokers for trading EUR/USD in 2025. Our list features brokers with competitive spreads, fast execution, and powerful platforms. Whether you're a beginner or an expert, find the right partner to navigate the dynamic Forex market.