Snap Stock News and Forecast: SNAP down 32% in premarket after earnings results
- Snap missed consensus for both earnings and revenue.
- Snap stock crashed 27.3% to $11.88 afterhours.
- The social media firm opted not to provide a Q3 outlook.

In a move reminiscent of the first quarter's stumble, Snap stock once again crashed following an earnings call. Just like it did when it reported Q1 results back in May, and subsequently fell 30%, Snap stock dropped more than 27% after it narrowly missed consensus that had already been revised lower ahead of the report. Additionally, due to macroeconomic uncertainty, the management team decided not to provide an outlook for the third quarter, which greatly added to uncertainty.
The results took the market by surprise as Snap advanced 5.4% to $16.35 in optimistic anticipation during the regular session on Thursday. In Friday's premarket, SNAP is trading off 32% at $11.12.
Snap stock earnings
Snap actually beat consensus by a penny for adjusted earnings per share (EPS) with $-0.02, but the market focused much more on the 5 cent miss on GAAP EPS of $-0.26. Revenue of $1.11 billion missed Wall Street forecasts by $23.4 million. Revenue still grew 13% YoY.
Overall net loss was $422 million compared with $152 million in the second quarter of 2021. As most tech stocks have been trying their best to curtail losses in the face of rising interest rates, Snap is moving in the wrong direction.
Average revenue per user (ARPU) fell from $3.35 one year ago to $3.20 as advertising took a hit. One strange detail was that management said they were authorizing $500 million in stock repurchases. Since they are not making any profit, are they going to borrow the money for that?
One point where the earnings results demonstrated some forward movement were the daily active user figures. Q2's 347 million DAU figure rose 18% YoY. Respect where due!
Snap stock forecast
No bottom fishing here! This one is going to need a sustained period to discover its support level. Snap is already below the mid-June low at $12 and may head toward $8. That price level was where SNAP bottomed during the low point of the Covid-19 panic in March 2020. Before the earnings release, Snap stock had just traded up to the 200-candle moving average (purple) on the 4-hour chart. Once the results came out, it quickly fell below the 100-candle moving average. The Moving Average Convergence Divergence (MACD) crossed over in a major bearish turn. Look out below!
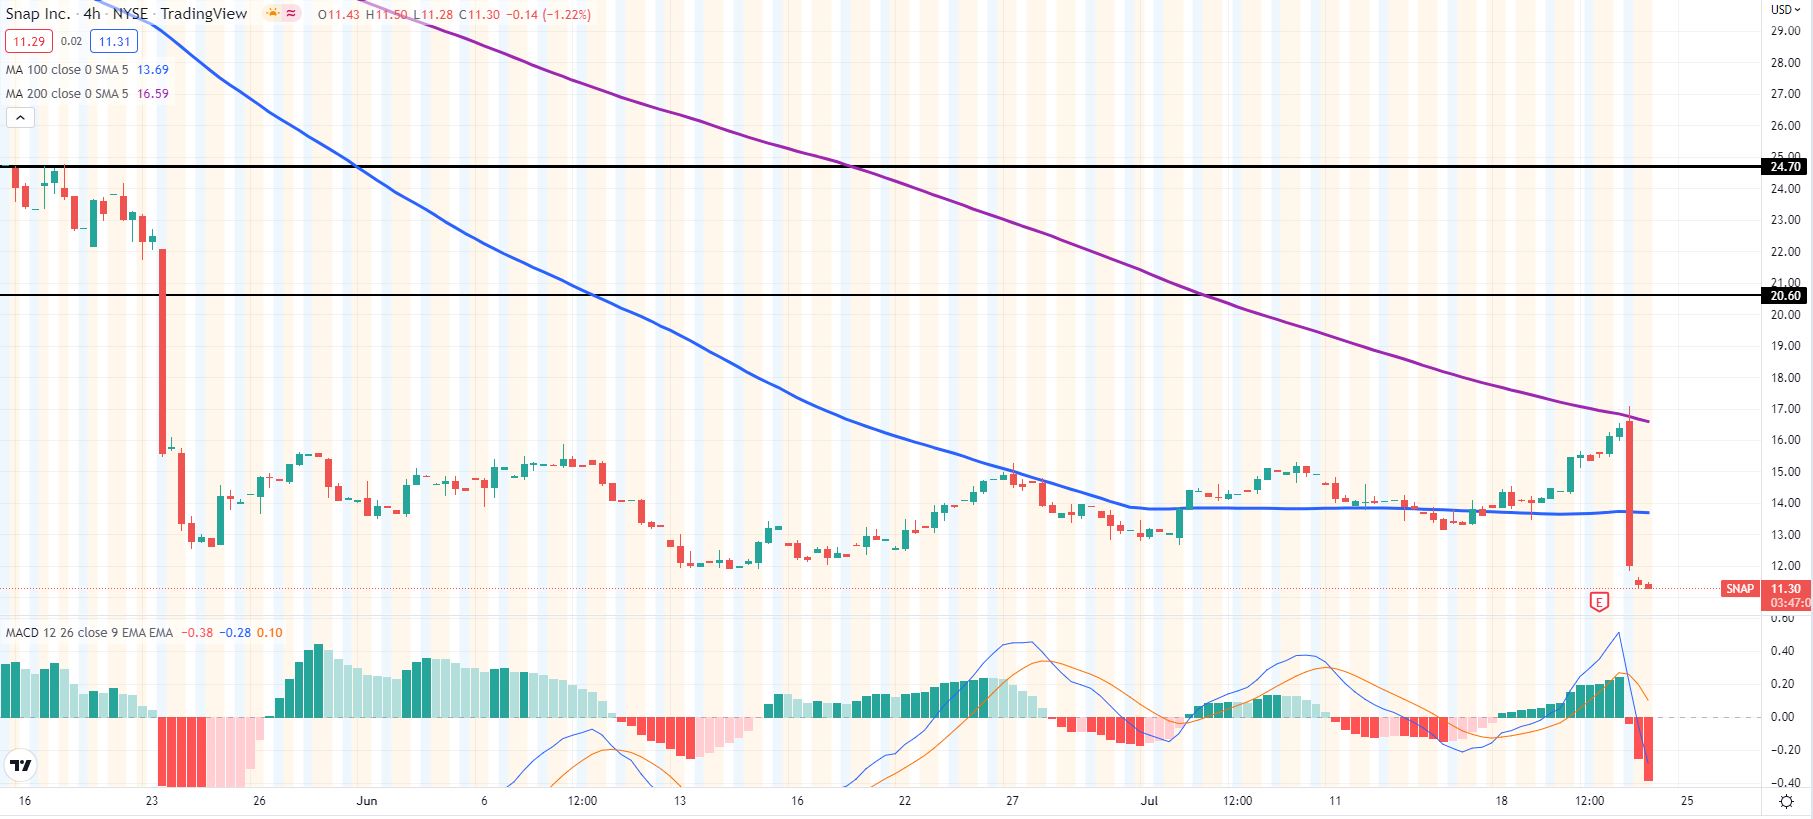
SNAP 4-hourt chart
Premium
You have reached your limit of 3 free articles for this month.
Start your subscription and get access to all our original articles.
Author

Clay Webster
FXStreet
Clay Webster grew up in the US outside Buffalo, New York and Lancaster, Pennsylvania. He began investing after college following the 2008 financial crisis.


