SmileDirect Club Inc Stock News and Forecast: Why is SDC stock down?
- Smile Direct is one of the new targets for a retail short squeeze.
- Smile Direct (Nasdaq:SDC) is a dental company, as the name suggests.
- The last results for SDC stock were not good.

Smile Direct (SDC) is one of the new potential short squeeze plays being examined by retail traders, as the short interest appears relatively high compared to stock market norms. Various reports put the short interest at over 30% and the latest Refinitiv data has the short interest showing at 32.89% of the free float. This is the one we focus on is the free float, as it is the number of shares available for trading – not the outstanding shares as this can include restricted shares etc. So, this is a high short interest, one of the highest currently on the market. The data is from the end of August, as the exchanges report short interest monthly.
Smile Direct Club (NASDAQ: SDC) is in the dental business, as the name suggests. The company provides a teledentistry-technology platform and offers a clear aligner treatment available through teledentistry. Smile Direct (SDC) has over 200 orthodontists in the US, which is its main area of business, and also the UK and Canada. The company recently announced an expansion into France, with the launch expected in Q4 of 2021. Smile Direct (SDC) will bring its premium clear aligners, telehealth platform and whitening system to the first France Smile shop in Paris this year.
Smile Direct (SDC) key statistics
| Market Cap | $2.43 billion |
| Price/Earnings | |
| Price/Sales | 3.8 |
| Price/Book | 2.4 |
| Enterprise Value | |
| Gross Margin | 68% |
| Net Margin |
-9% |
| 52-week high | $16.0799 |
| 52-week low | $4.63 |
| Short Interest | 32.89% |
| Average Wall Street Rating and Price Target | HOLD $6.95 |
Smile Direct (SDC) stock news
The most recent set of earnings for SDC were not well received by the market, with several investment banks cutting price targets afterwards, and investors selling the stock. The results were released on August 9 and SDC stock fell 24% on the day after.
Smile Direct (SDC) reported a loss of $0.14 US cents per share against expectations for a loss of 9 cents per share, so over 50% worse than expected. Revenue did rise significantly from last year hitting $174 million, but the expectation was for $198.5 million, so again, well behind expectations from Wall Street.
At the time of the earnings release, the average rating from Wall Street analysts was a "buy", but now that has changed to "hold" as analysts downgraded their ratings and price targets after the results. The day after the results JPMorgan, Jefferies and Stephens cut their price targets for Smile Direct (SDC) stock.
However, it was the short interest that attracted traders on social media to the stock, as the name quickly spread and the stock spiked 16% on September 13.
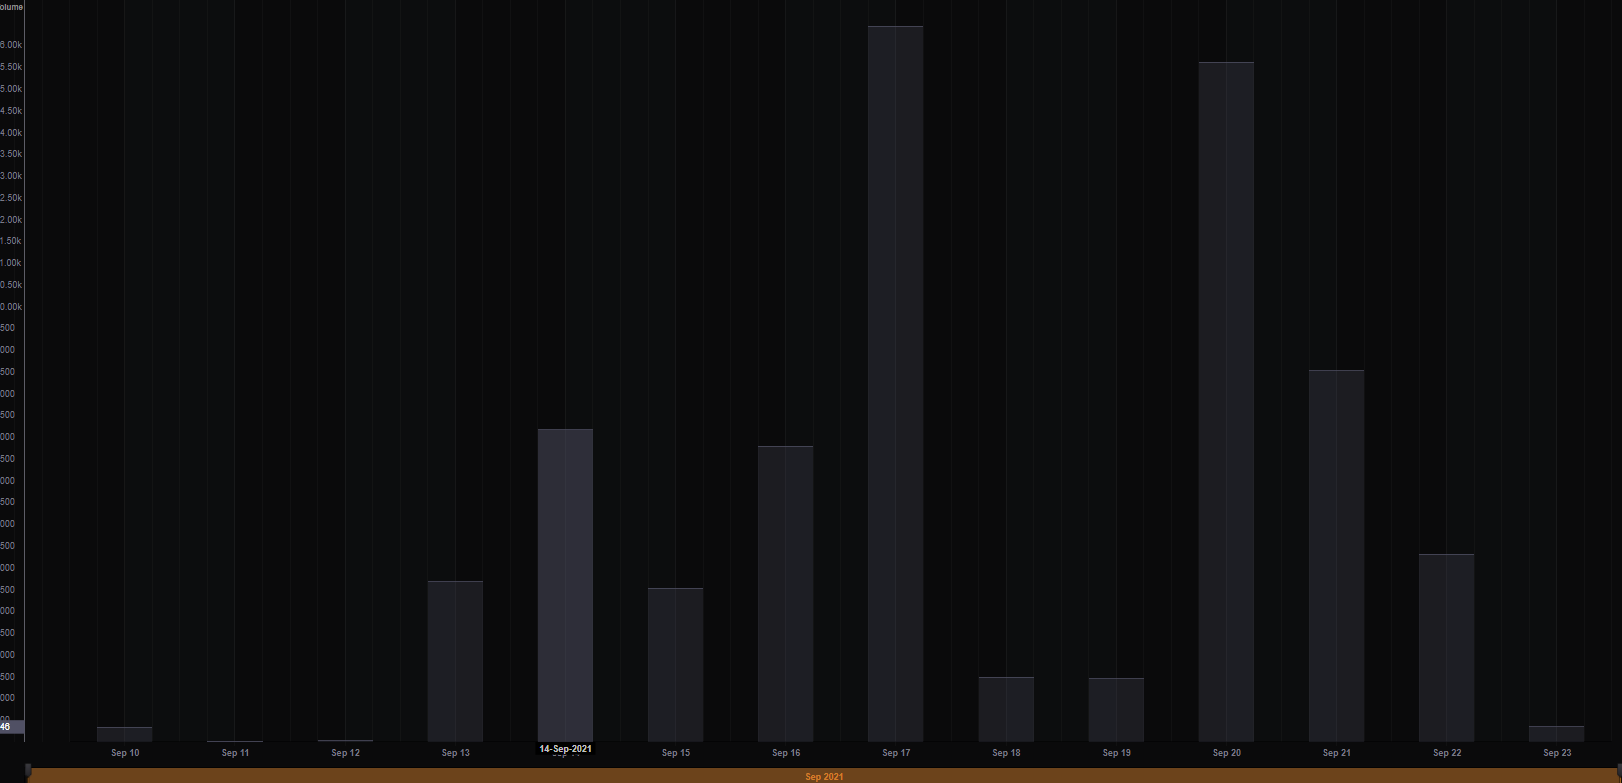
SDC social interest chart
The Refinitiv social media monitor actually shows mentions spiking on September 17, SDC stock did rally 11.67% on this day.
Smile Direct (SDC) stock forecast
This is another short squeeze. SDC is not a typical buy-and-hold profitable stock, so just know that if you are trading this, it is highly volatile. Risk warning over, if you want to have fun go ahead! However, we are bearish on this one and I know you will not be happy to hear that. But we have to call it as we see it.
Ignoring the poor financials let's focus on the chart. What we have is a long-term downtrend and the recent spike has topped out lower than the previous spikes. This has been a feature of many meme stocks, as the power is getting weaker as 2021 progresses. Look at AMC and GME, for example. The spikes earlier in the year are higher than now. So, a bearish trend then. But yes, a short squeeze can have dramatic effects, but to do so the move must be really painful and sustained.
A quick sharp spike is not going to make shorts cover their positions, they will just ride it out. This is a power game: who is bigger, who has more firepower, the shorts or the squeezers? In this case, think the shorts as the move is not going to last long enough to squeeze the shorts to cover. The short interest is high but not GameStop (GME) high. I could be wrong but that is all the longs have.
The stock is not profitable and that is the reason why it was shorted in the first place. Yes, AMC and GME worked but already it is proving harder to maintain interest and squeeze names and those also had higher short interests. GameStop was unique, as it captured a huge amount of concentrated interest. Now, retail traders have their focused spread among a much bigger list of stocks whereas earlier in the year they all focused on GME and then AMC.
However, just going back to the chart if you longs do manage to get above $7.50, then you may have a change as volume thins out above there, not dramatically but perhaps enough to sustain the move a bit longer. But so far, all SDC has done is fill the earnings gap – markets love to fill a gap but that is often it, fill the gap and then resume the trend which in this case is bearish. $6.78 is the point of control and so a high volume, resistance area.
FXStreet View: SDC bearish, neutral on a break above $7.50, bullish above $11.02.
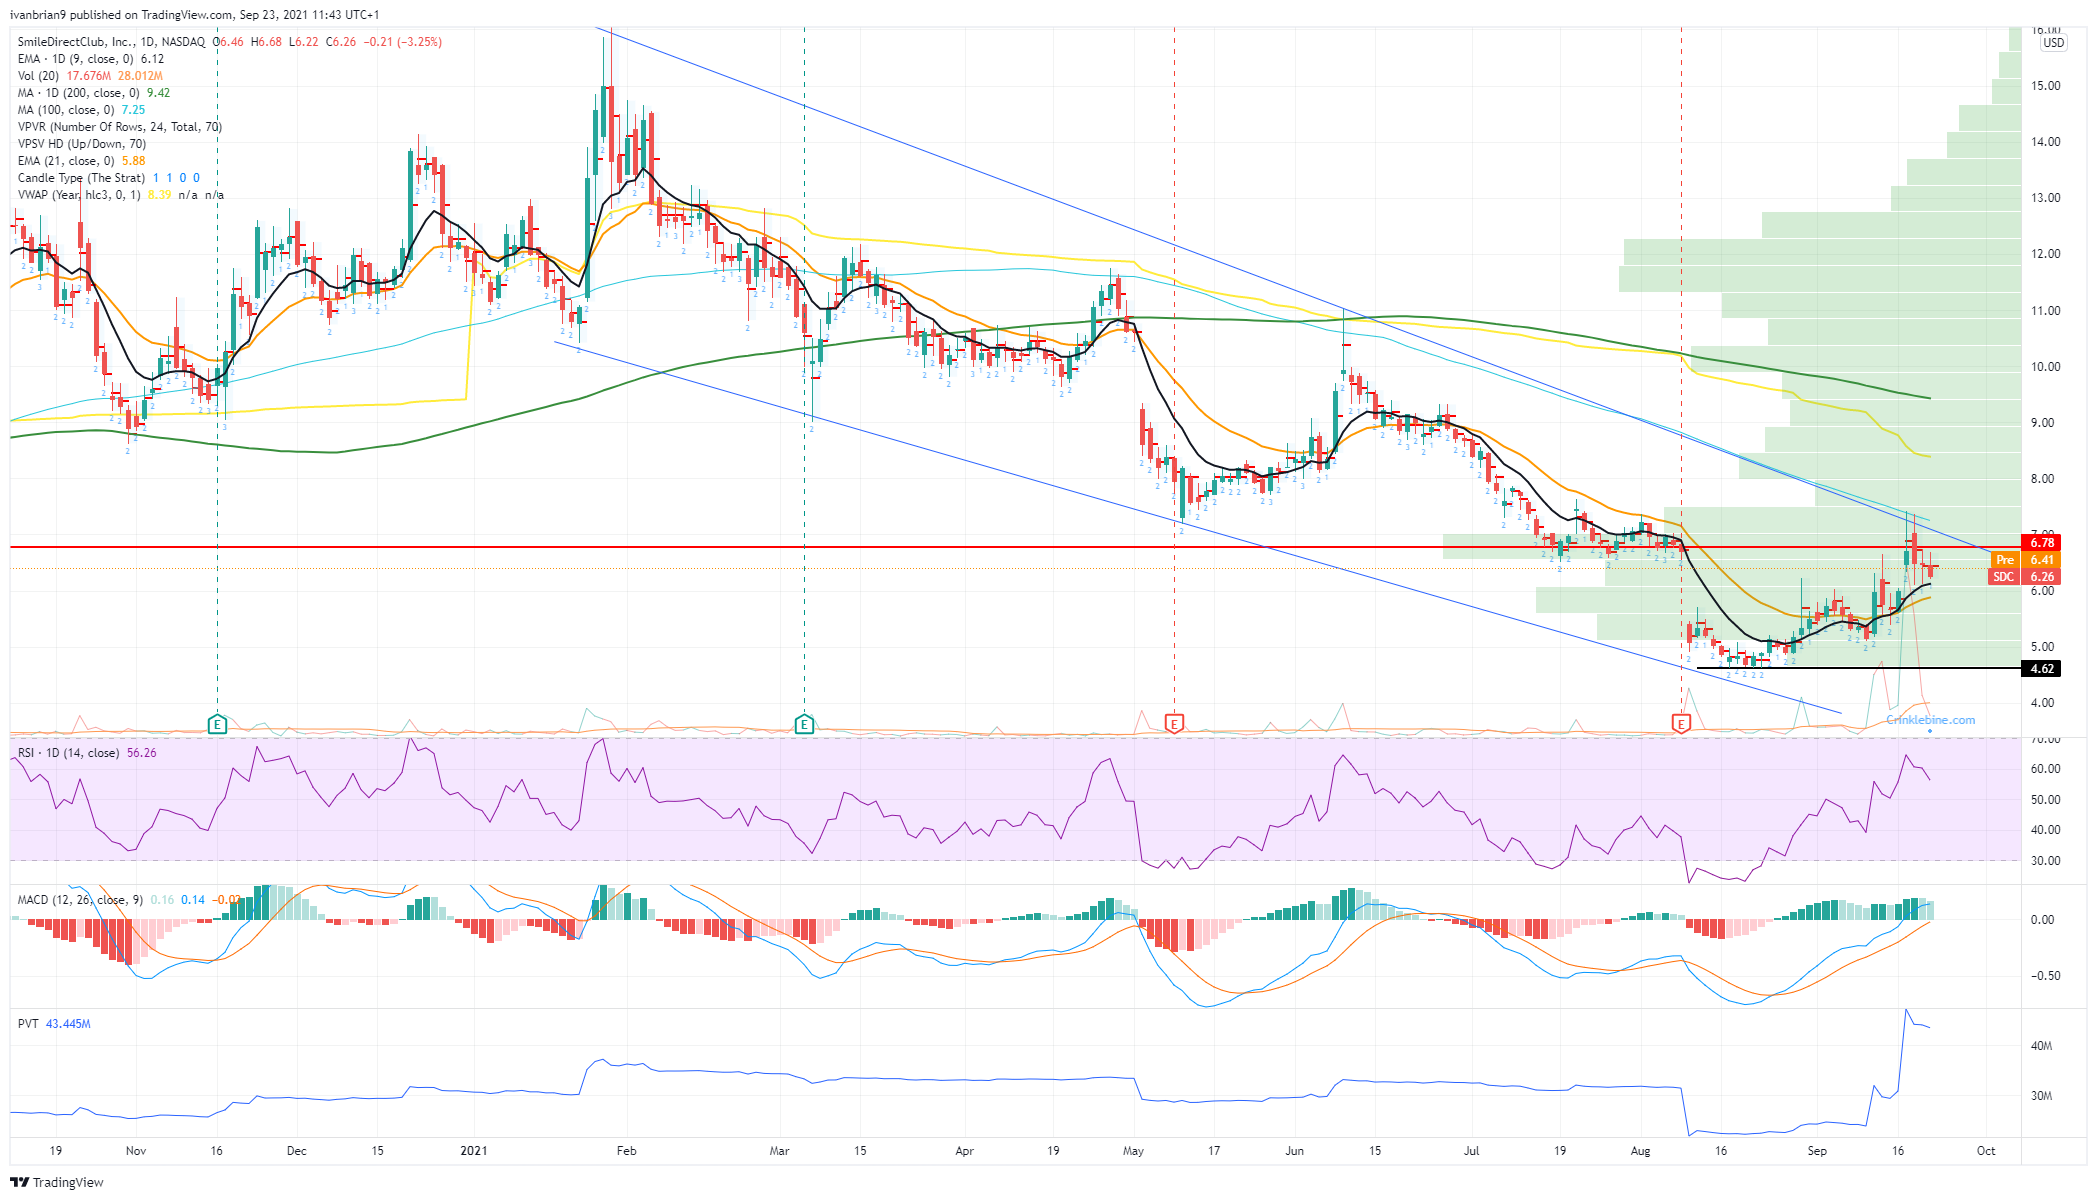
SDC daily chart
Premium
You have reached your limit of 3 free articles for this month.
Start your subscription and get access to all our original articles.
Author

Ivan Brian
FXStreet
Ivan Brian started his career with AIB Bank in corporate finance and then worked for seven years at Baxter. He started as a macro analyst before becoming Head of Research and then CFO.


