|

SMI (Swiss Index) entered in a triple correction structure

The Swiss Market Index (SMI) is Switzerland’s blue-chip stock market index, which makes it the most followed in the country. It is made up of 20 of the largest and most liquid Swiss Performance Index (SPI) stocks. The SMI is not adjusted for dividends.

SMI December 04th daily chart

Chart

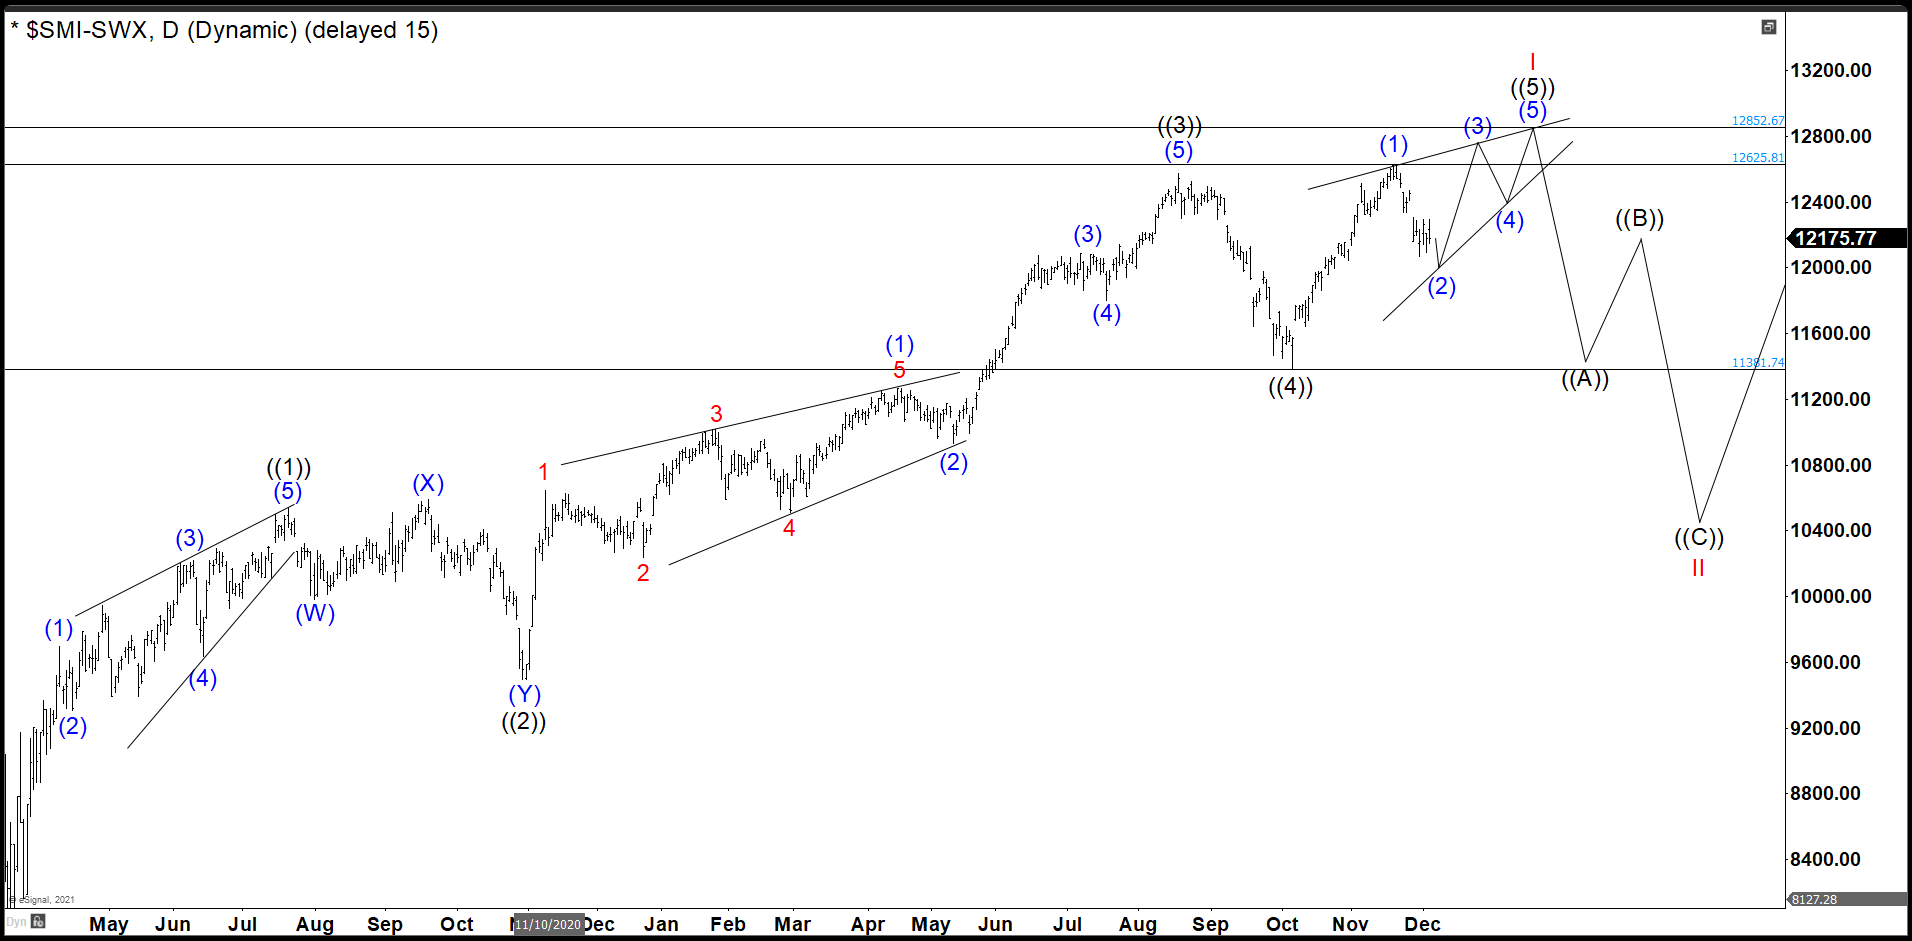
This is last year’s chart, where we looked to end an impulse from the March 2020 low with an ending diagonal structure. From there we expected a retracement to correct the entire cycle.

SMI June 26th daily chart

Chart

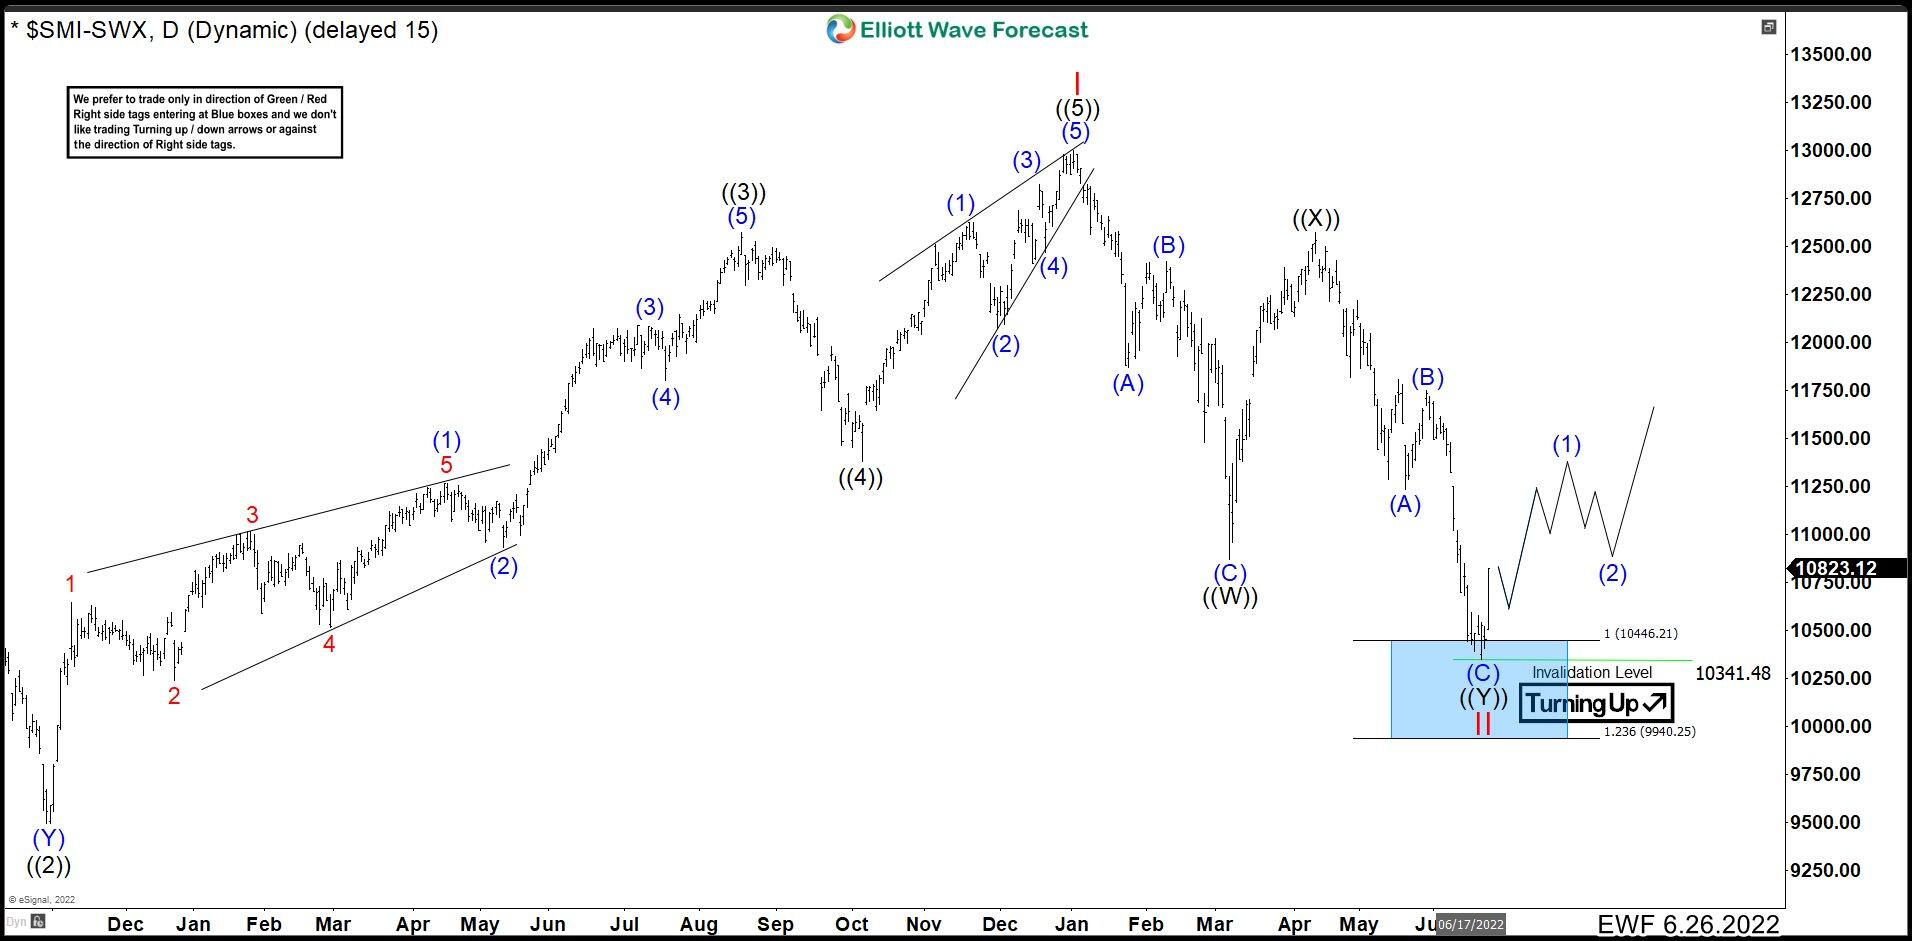
In this June 2022 chart, we can see SMI index ended wave I at 12997 and wave ((5)) as an ending diagonal structure. From here, market did a double correction structure to the blue box and we expected to continue the rally or see 3 swings higher at least. (If you want to learn more about double correction or Elliott Wave Theory, follow these links: Elliott Wave Education and Elliott Wave Theory).

SMI October 28th daily chart

Chart

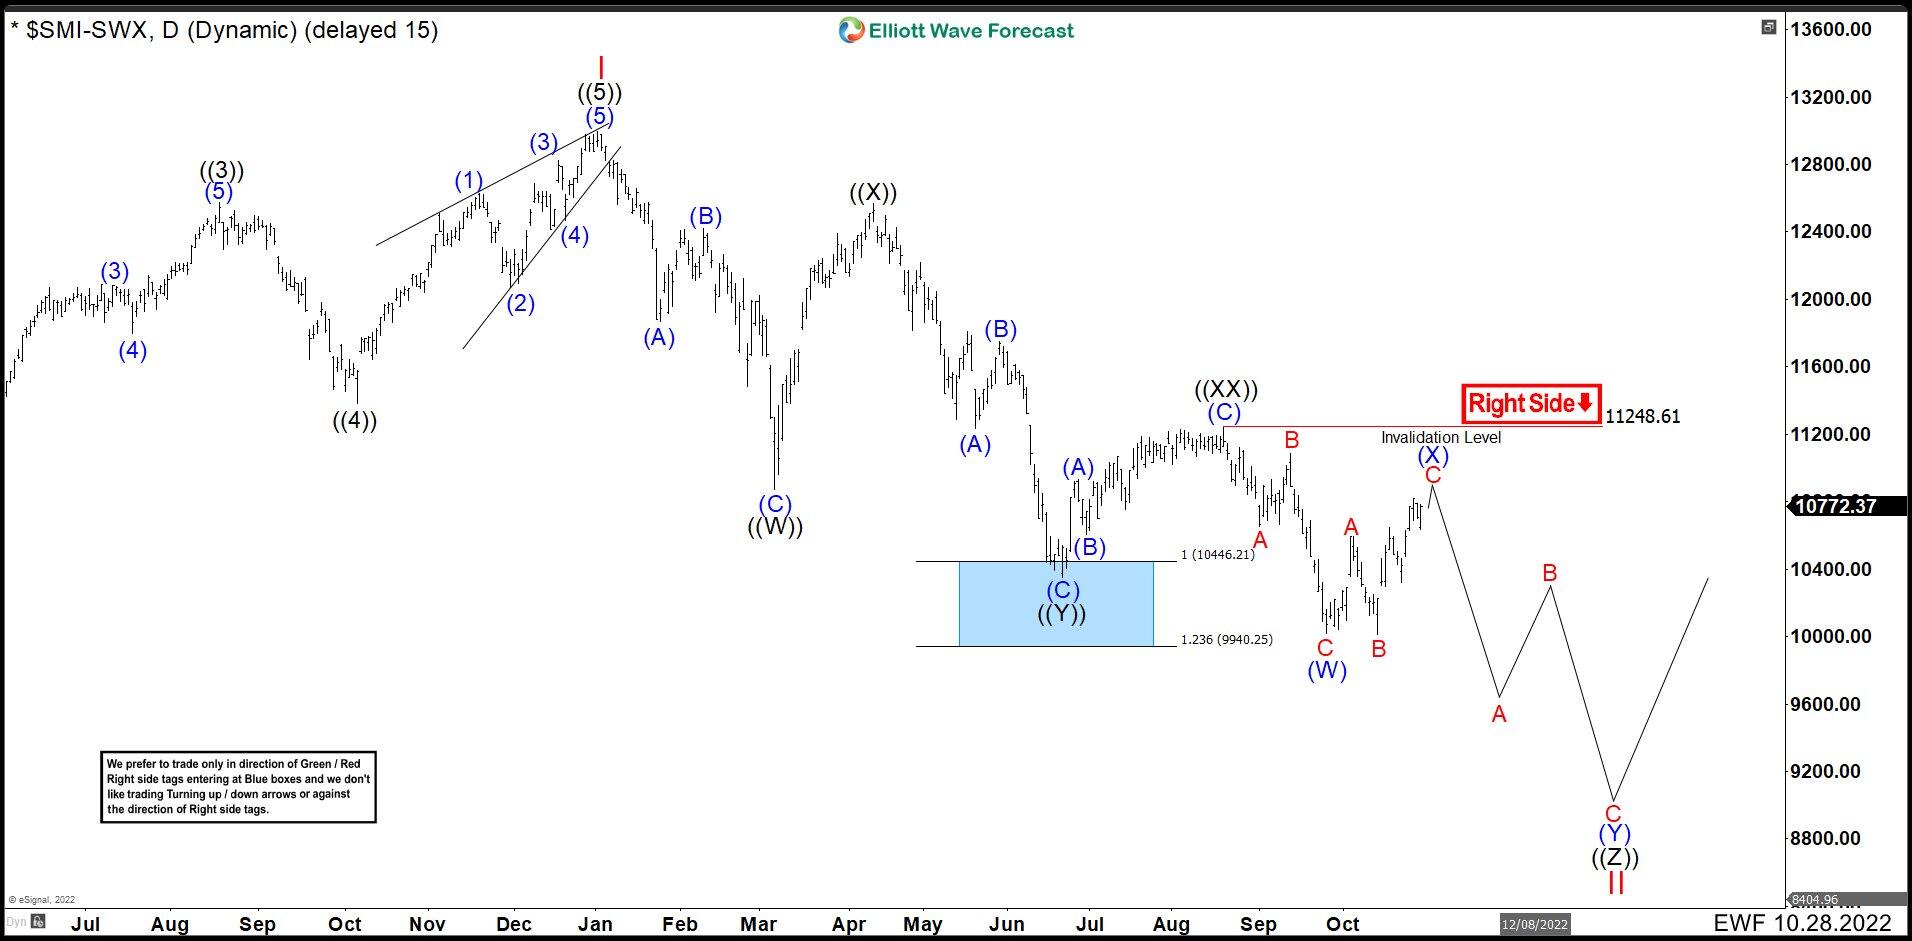
The bounce could never have bullish momentum and after a short rally the market broke below 10340.75 creating a bearish sequence. We adjusted the count as a triple correction because rally was a bit short. SMI completed wave ((XX)) at 11248.61 and resumed down in 3 swings to end wave (W) at 10016.06. Currently, it is building the connector (X) as a flat correction. For this, we need at least one more high above 10821.77 to complete an impulse C before continue the move down in wave ((Z)).

The count is valid as long as it is below 11248.61. A break of this level the SMI would enter a much more complex correction. To complete the triple correction, we must break the low of 10016.06 in 3 swings at least. Once this is done, the market can continue to rally at any time or continue to run lower with 3 more swings.

Author

Elliott Wave Forecast Team

Elliott Wave Forecast Team

ElliottWave-Forecast.com

More from Elliott Wave Forecast Team
Share:

Editor's Picks

EUR/USD flirts with daily highs, retargets 1.1900

EUR/USD regains upside traction, returning to the 1.1880 zone and refocusing its attention to the key 1.1900 barrier. The pair’s slight gains comes against the backdrop of a humble decline in the US Dollar as investors continue to assess the latest US CPI readings and the potential Fed’s rate path.

GBP/USD remains well bid around 1.3650

GBP/USD maintains its upside momentum in place, hovering around daily highs near 1.3650 and setting aside part of the recent three-day drop. Cable’s improved sentiment comes on the back of the Greenback’s  irresolute price action, while recent hawkish comments from the BoE’s Pill also collaborate with the uptick.

Gold clings to gains just above $5,000/oz

Gold is reclaiming part of the ground lost on Wednesday’s marked decline, as bargain-hunters keep piling up and lifting prices past the key $5,000 per troy ounce. The precious metal’s move higher is also underpinned by the slight pullback in the US Dollar and declining US Treasury yields across the curve.

Crypto Today: Bitcoin, Ethereum, XRP in choppy price action, weighed down by falling institutional interest 

Bitcoin's upside remains largely constrained amid weak technicals and declining institutional interest. Ethereum trades sideways above $1,900 support with the upside capped below $2,000 amid ETF outflows.

Week ahead – Data blitz, Fed Minutes and RBNZ decision in the spotlight

US GDP and PCE inflation are main highlights, plus the Fed minutes. UK and Japan have busy calendars too with focus on CPI. Flash PMIs for February will also be doing the rounds. RBNZ meets, is unlikely to follow RBA’s hawkish path.

Ripple Price Forecast: XRP potential bottom could be in sight

Ripple edges up above the intraday low of $1.35 at the time of writing on Friday amid mixed price actions across the crypto market. The remittance token failed to hold support at $1.40 the previous day, reflecting risk-off sentiment amid a decline in retail and institutional sentiment.