|

SMH semiconductor ETF reacted from a blue box breaking to new highs

The VanEck Semiconductor ETF (SMH) is an exchange-traded fund that tracks a market-cap weighted index composed of 25 of the largest U.S.-listed semiconductor companies. The top holdings of SMH include companies like NVIDIA, Taiwan Semiconductor Manufacturing, Broadcom Inc., Texas Instruments, QUALCOMM, ASML Holding N.V., Applied Materials, Inc., Lam Research Corporation, Micron Technology, Inc., and Advanced Micro Devices, Inc.

SMH four-hour chart April 19th

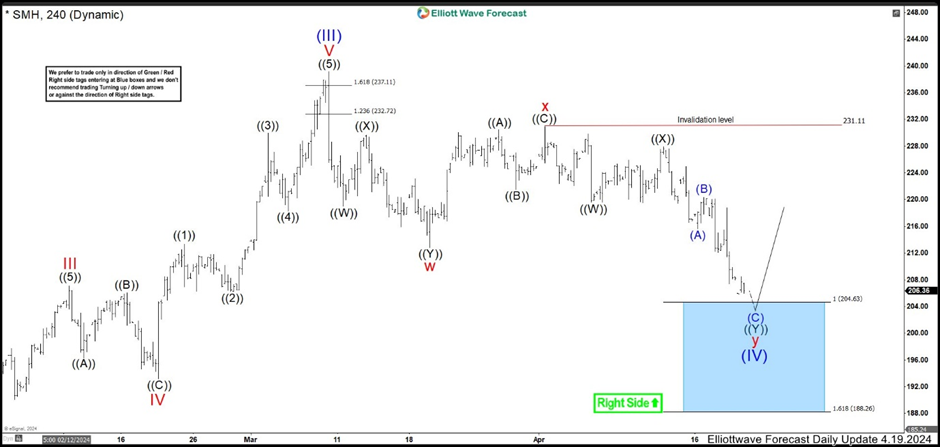
In March 2024, the ETF made a peak at 239.14 high and we called as wave (III). Then, the market started a pullback and we called a double correction structure. Down from the peak, we can see 3 swings that ended wave w at 212.82 low. Another 3 swings bounced to finish wave x at 230.95 high. From here, we were looking for 3 swings more to the downside to reach 204.63 – 188.26 area. In the blue box, we were expecting that buyers appear to call wave y and wave (IV) ended and resume the rally in wave (V).

SMH four-hour chart May 23th

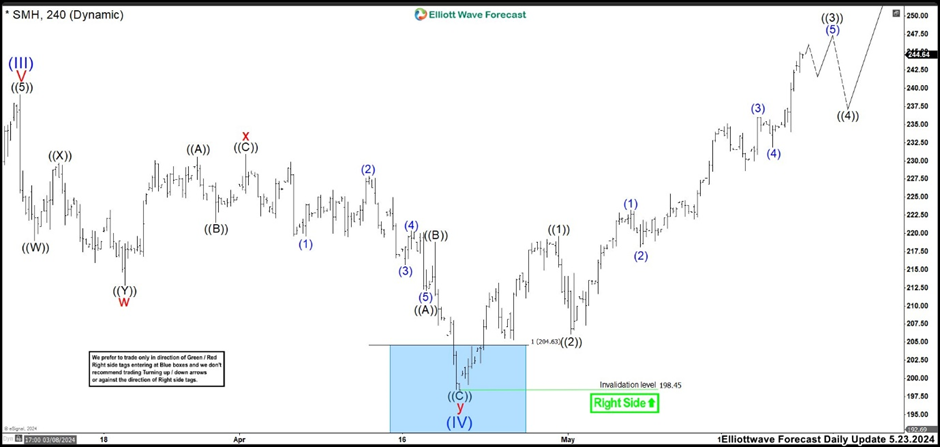
After a month, We can see SMH reached the blue box ended wave (IV) at 198.41 low and rally as expected. The ETF is developing an impulse as wave I of (V) and we see the structure incomplete at the moment. The uptrend ended wave ((1)) of I at 219.62 high. Then we had a fast correction as wave ((2)) ending at 206.11 low. The market remained up with a strong momentum in wave ((3)). Wave (1) of ((3)) ended at 223.18 high. Wave (2) correction at 218.11 low. The rally continued ending wave (3) at 236.04 high and wave (4) pullback at 231.87 low.

After NVDA earnings results, SMH broke higher above wave (III) peak confirming more upside extension. Currently, wave (5) of ((3)) could be near to end. When we see a strong correction as wave ((2)), wave ((3)) should be ended and we would expect 3, 7 or 11 swings correction to complete wave ((4)) before resuming to the upside in wave ((5)) of 1. The strategy is looking for buying opportunities after wave ((4)) is completed to trade wave ((5)) higher.

Author

Elliott Wave Forecast Team

Elliott Wave Forecast Team

ElliottWave-Forecast.com

More from Elliott Wave Forecast Team
Share:

Markets move fast. We move first.

Orange Juice Newsletter brings you expert driven insights - not headlines. Every day on your inbox.

By subscribing you agree to our Terms and conditions.

Editor's Picks

EUR/USD trades with negative bias around 1.1730 amid recovering USD; downside seems limited

The EUR/USD pair kicks off the new week on a softer note, though it remains within striking distance of the highest level since early October, touched last Thursday. Spot prices currently trade around the 1.1730 region, down less than 0.10% for the day.

GBP/USD holds steady above mid-1.3300s as traders await key data and BoE this week

The GBP/USD pair remains on the defensive during the Asian session on Monday, though it lacks bearish conviction and holds above the 200-day Simple Moving Average pivotal support. Spot prices currently trade around the 1.3360 region, nearly unchanged for the day.

Gold retains bullish bias ahead of this week’s key US macro releases

Gold attracts buyers for the fifth straight day and climbs to the $4,330 region during the Asian session on Monday. The commodity remains well within striking distance of its highest level since October 21, touched on Friday, and seems poised to appreciate further amid a supportive fundamental backdrop. 

Solana consolidates as spot ETF inflows near $1 billion signal institutional dip-buying

Solana price hovers above $131 at the time of writing on Monday, nearing the upper boundary of a falling wedge pattern, awaiting a decisive breakout. On the institutional side, demand for spot Solana Exchange-Traded Funds remained firm, pushing total assets under management to nearly $1 billion since launch. 

Big week ends with big doubts

The S&P 500 continued to push higher yesterday as the US 2-year yield wavered around the 3.50% mark following a Federal Reserve (Fed) rate cut earlier this week that was ultimately perceived as not that hawkish after all. The cut is especially boosting the non-tech pockets of the market.

Solana Price Forecast: SOL consolidates as spot ETF inflows near $1 billion signal institutional dip-buying

Solana (SOL) price hovers above $131 at the time of writing on Monday, nearing the upper boundary of a falling wedge pattern, awaiting a decisive breakout.