SMH Semiconductor ETF rally continuation should be around the corner

The VanEck Semiconductor ETF (SMH) is an exchange-traded fund that tracks a market-cap weighted index composed of 25 of the largest U.S.-listed semiconductor companies. The top holdings of SMH include companies like NVIDIA, Taiwan Semiconductor Manufacturing, Broadcom Inc., Texas Instruments, QUALCOMM, ASML Holding N.V., Applied Materials, Inc., Lam Research Corporation, Micron Technology, Inc., and Advanced Micro Devices, Inc.
SMH four-hour chart September 11th
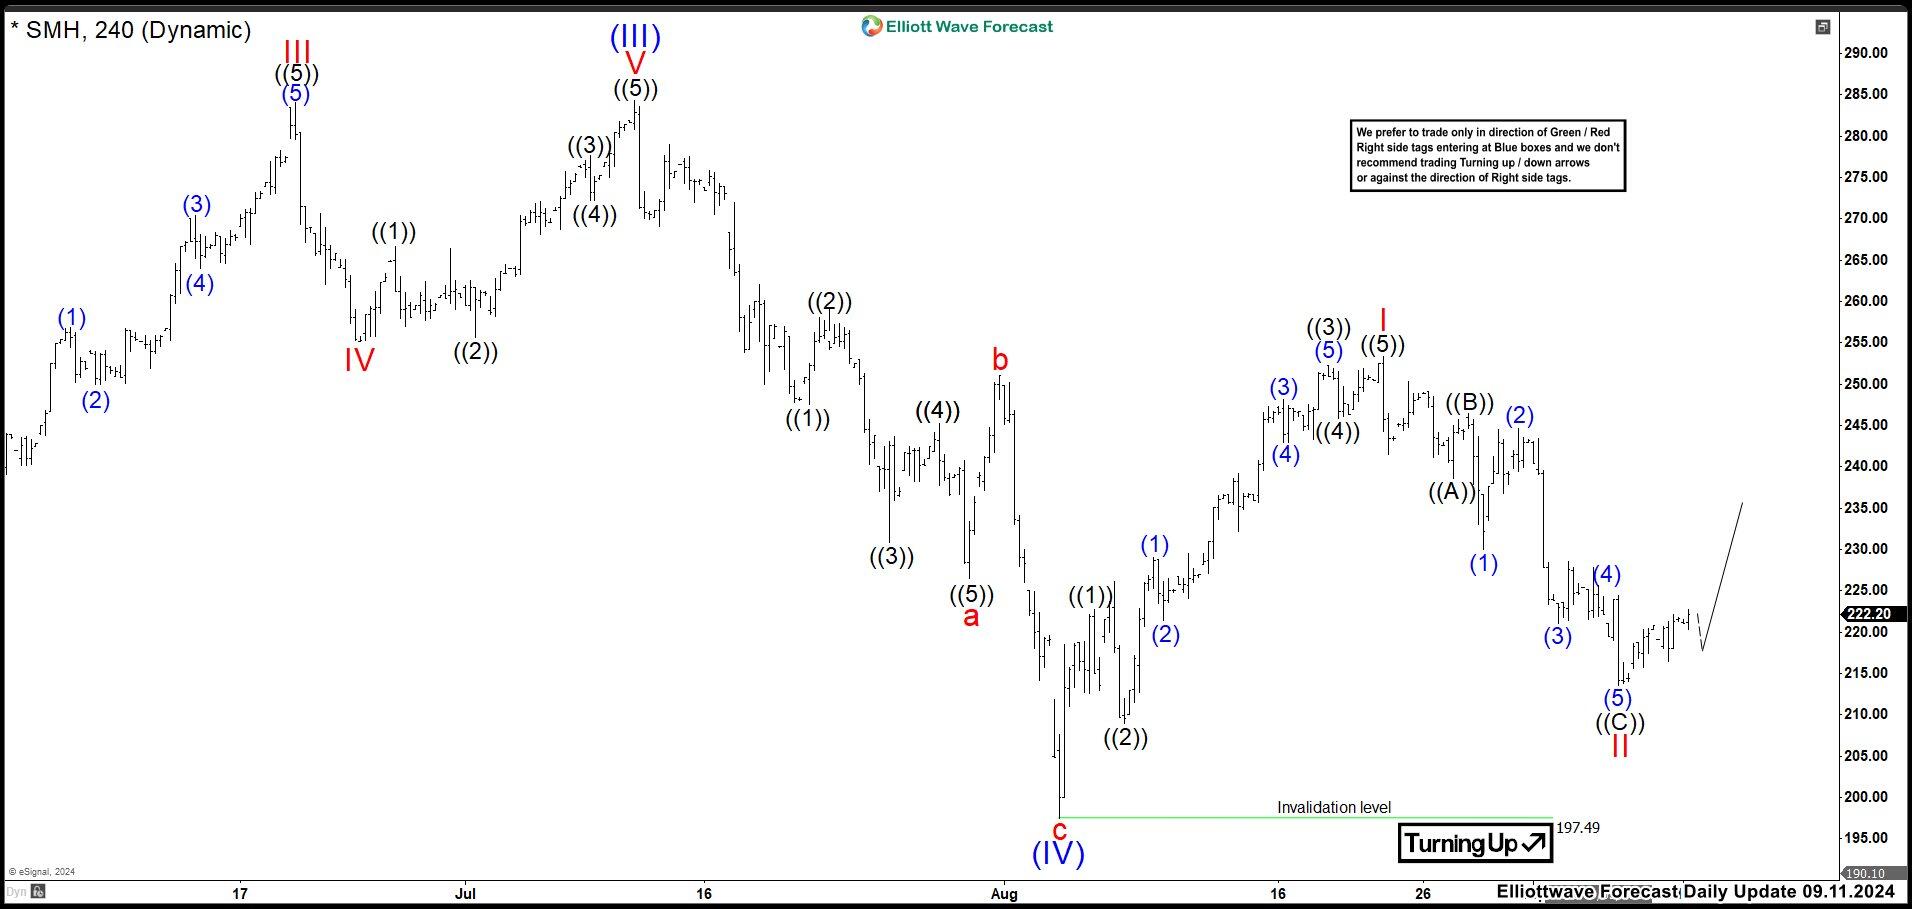
Last September 11th, we talked about SMH. After completing wave (III), we had a deep pullback as a zig zag correction. Down from wave (III), wave “a”ended at 226.50 low and bounced as wave “b” ended at 251.00 high. Last push lower completed wave “c” and a wave (IV) at 197.50 low. Then, SMH started the uptrend again and wave (V). It built an impulse structure ending at 253.32 high as wave I. Pullback as wave II ended at 213.57 low. From here, we were expecting to continue the rally in wave III of (V). Ideally, the market should break 284.26 high as target to end wave (V). In case, if this rally would not break above wave (III), the next target to keep an eye comes around 269.50 level.
SMH daily chart January 16th
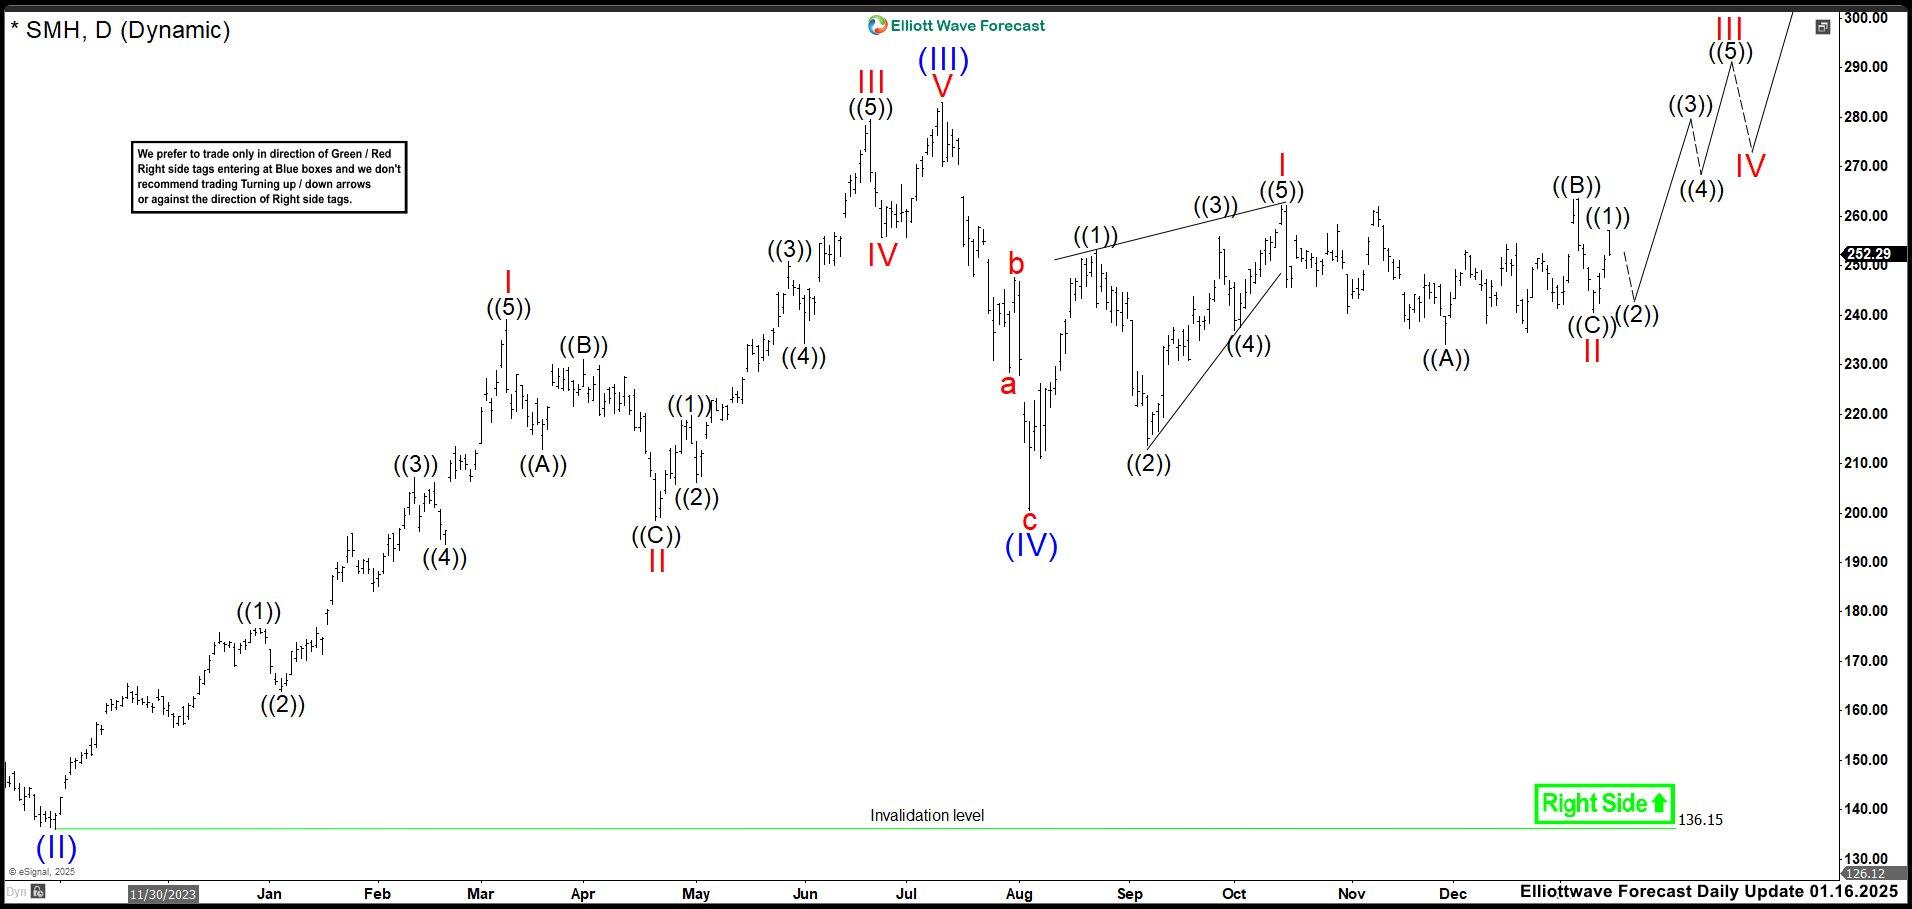
Currently in the daily timeframe, the semiconductors ETF has moved sideways between 230 – 260 dollars. The market rally as expected from 222.20 as the last chart, but it has not been strong enough to break the peak and even worse to reach 269.50 level. Therefore, we adjusted the chart calling the wave I as a leading diagonal ending at 262.26 high. The ranging since October 2024 until today should be the wave II correction. We are calling a running flat correction for this purpose. For us, the wave III has started and wave ((1)) of III ended at 257.20 high and now it is trading in wave ((2)) pullback. As price action remains above 240.62 low, we are expecting for more upside to break 283.07 high.
Besides, as we are calling a running flat correctionas wave II, we cannot rule an expanded flat correction as wave II. That means, if market breaks 240.62 low, SMH should continue lower to 235.29 – 228.61 area to finish wave II before resuming the rally. Let’s see how the market treats us. Trade Smart!
Author

Elliott Wave Forecast Team
ElliottWave-Forecast.com


