SMH Elliott Wave technical analysis [Video]
![SMH Elliott Wave technical analysis [Video]](https://editorial.fxstreet.com/images/Markets/Equities/Industries/Materials/extracting_mine_materials2_XtraLarge.jpg)
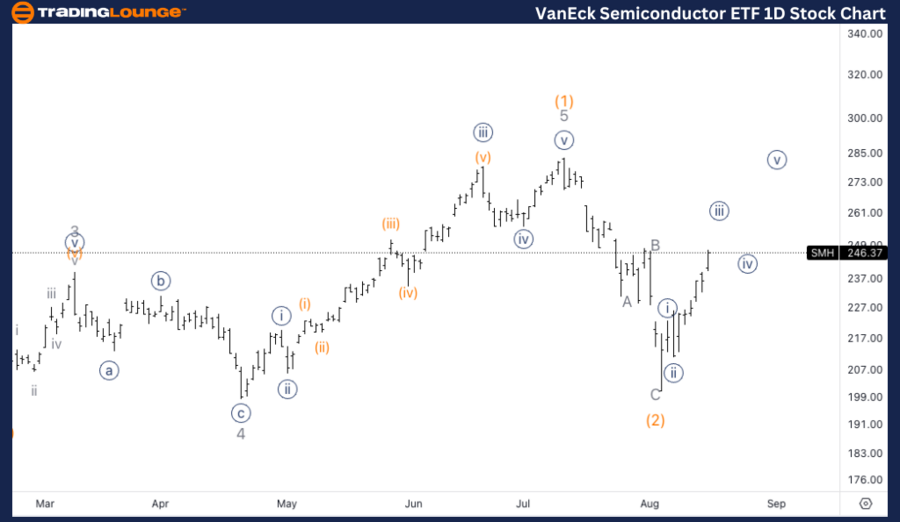
SMH Elliott Wave Analysis Trading Lounge Daily Chart,
VanEck Semiconductor ETF, (SMH) Daily Chart.
SMH Elliott Wave technical analysis
Function: Trend.
Mode: Impulsive.
Structure: Motive.
Position: Wave 1 of (3).
Direction: Upside into wave 1.
Details: Looking for a clear five wave move off the 200$ lows, in order to have additional confirmation about upside potential.
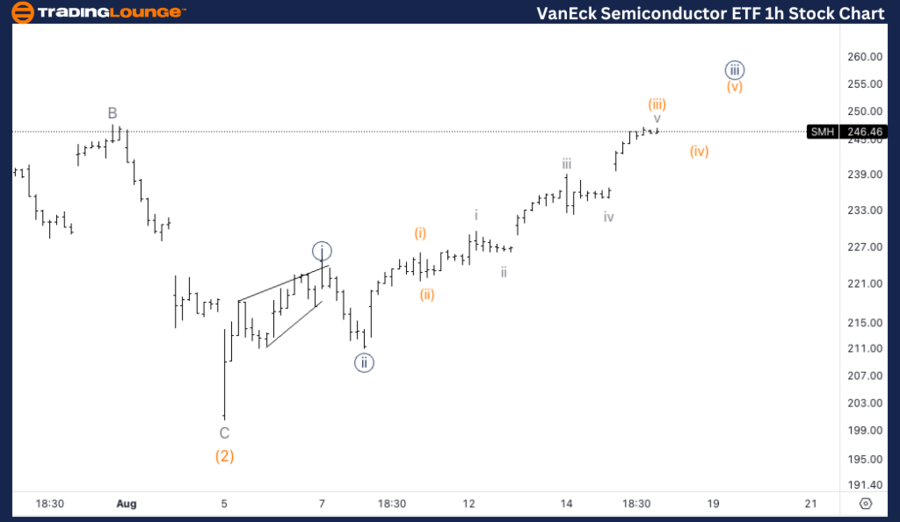
SMH Elliott Wave Analysis Trading Lounge 1H Chart,
VanEck Semiconductor ETF, (SMH) 1H Chart
SMH Elliott Wave technical analysis
Function: Trend.
Mode: Impulsive.
Structure: Motive.
Position: Wave {iii} of 1.
Direction: Upside in wave {iii}.
Details: Looking for upside into wave {iii} as we seem to be unfolding higher, and we are now approaching previous wave B, which, if broken, it’ll give us additional upside confirmation.
Welcome to our latest Elliott Wave analysis for VanEck Semiconductor ETF (SMH) as of August 16, 2024. This analysis examines SMH's price movements using the Elliott Wave Theory, offering insights to traders on potential opportunities based on the current market structure and trends. We'll analyze both the daily and 1-hour charts to provide a detailed view of SMH's market behavior.
SMH Elliott Wave technical analysis – Daily chart
We are observing the formation of a clear five-wave structure off the recent $200 lows. This wave 1 of (3) is critical for confirming the broader upside potential. A well-defined five-wave move will provide additional confidence in the ongoing trend, supporting the view that SMH is poised for further gains as it progresses into wave 3.
SMH Elliott Wave technical analysis – One-hour chart
The short-term view suggests that SMH is unfolding higher within wave {iii} of 1. As we approach the previous wave B level, a break above this resistance would provide additional confirmation of continued upside. This would solidify the view that wave {iii} is actively driving the price higher, reinforcing the bullish outlook.
Technical analyst: Alessio Barretta.
SMH Elliott Wave technical analysis [Video]
Author

Peter Mathers
TradingLounge
Peter Mathers started actively trading in 1982. He began his career at Hoei and Shoin, a Japanese futures trading company.


