Silver Price Forecast: XAG/USD slips below $34 as bearish wedge forms
- Silver falls 1.2% to $33.69 as short-term chart hints at bearish wedge despite intact uptrend.
- RSI still bullish but showing signs of fading momentum as sellers start to pressure price action.
- Break below $33.47 could trigger test of $33.00 and 50-day SMA at $32.41; above $34.00, bulls may retarget $34.58.
Silver prices retreated for the second consecutive day this week, dropping approximately 1.20% on Tuesday and falling below the $34.00 mark. As Wednesday’s Asian session begins, XAG/USD trades at $33.69, nearly unchanged.
XAG/USD Price Forecast: Technical outlook
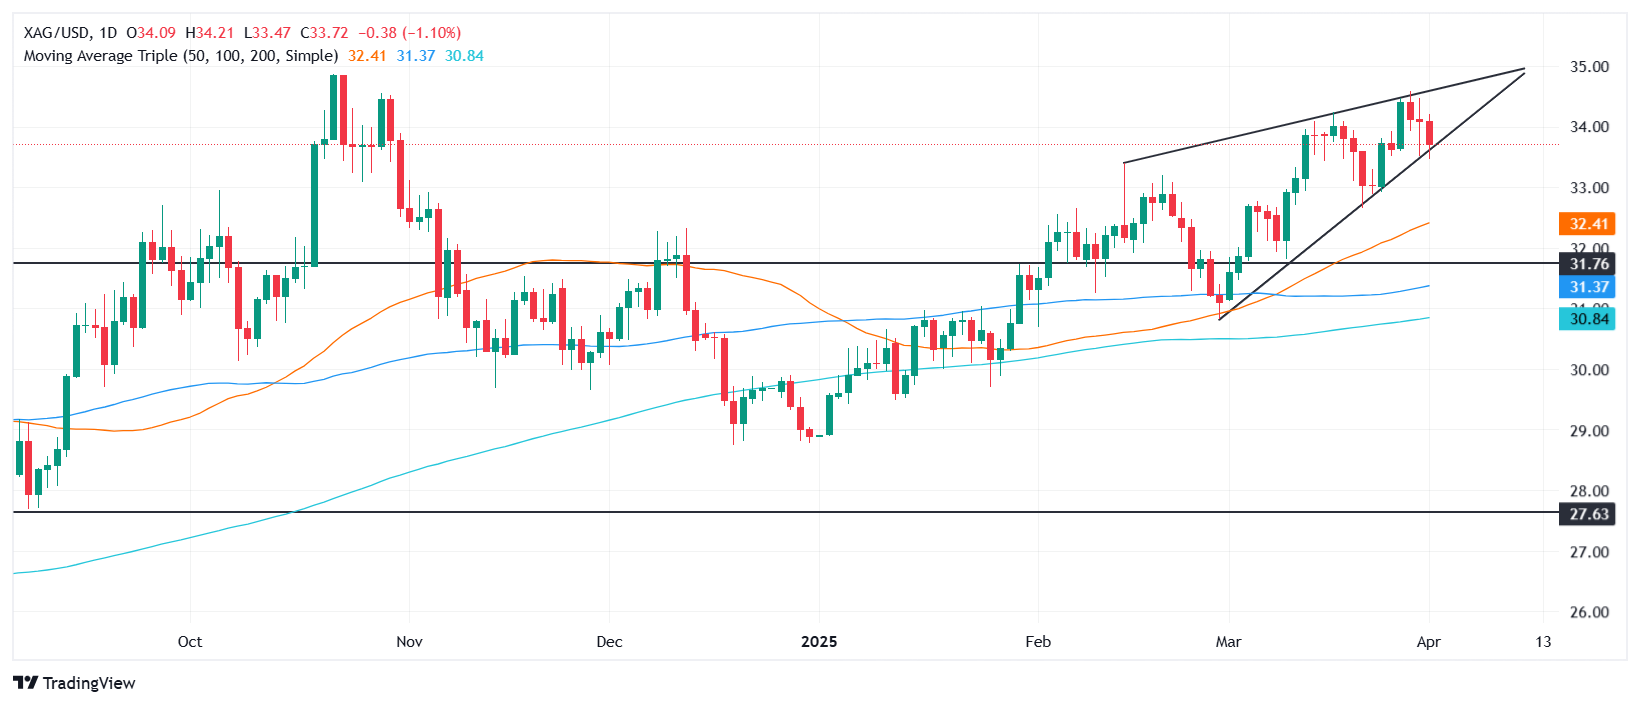
Silver’s uptrend remains intact, but so far, it appears the grey metal is forming a ‘bearish wedge,’ which is preceded by an uptrend. This pattern typically presents itself during a downtrend, acting as a countertrend move, before sellers outpace buyers, causing prices to fall lower.
The Relative Strength Index (RSI) suggests that sellers are gaining momentum, although it remains bullish.
In the short term, if XAG/USD drops below $33.47, the wedge’s bottom trendline will be in play. If cleared and Silver falls beneath $33.00, look for a decline to test the 50-day Simple Moving Average (SMA) at $32.41.
On the other hand, if Siver climbs past $34.00, buyers would remain in charge and challenge the March 28 peak of $34.58.
XAG/USD Price Chart – Daily
Silver FAQs
Silver is a precious metal highly traded among investors. It has been historically used as a store of value and a medium of exchange. Although less popular than Gold, traders may turn to Silver to diversify their investment portfolio, for its intrinsic value or as a potential hedge during high-inflation periods. Investors can buy physical Silver, in coins or in bars, or trade it through vehicles such as Exchange Traded Funds, which track its price on international markets.
Silver prices can move due to a wide range of factors. Geopolitical instability or fears of a deep recession can make Silver price escalate due to its safe-haven status, although to a lesser extent than Gold's. As a yieldless asset, Silver tends to rise with lower interest rates. Its moves also depend on how the US Dollar (USD) behaves as the asset is priced in dollars (XAG/USD). A strong Dollar tends to keep the price of Silver at bay, whereas a weaker Dollar is likely to propel prices up. Other factors such as investment demand, mining supply – Silver is much more abundant than Gold – and recycling rates can also affect prices.
Silver is widely used in industry, particularly in sectors such as electronics or solar energy, as it has one of the highest electric conductivity of all metals – more than Copper and Gold. A surge in demand can increase prices, while a decline tends to lower them. Dynamics in the US, Chinese and Indian economies can also contribute to price swings: for the US and particularly China, their big industrial sectors use Silver in various processes; in India, consumers’ demand for the precious metal for jewellery also plays a key role in setting prices.
Silver prices tend to follow Gold's moves. When Gold prices rise, Silver typically follows suit, as their status as safe-haven assets is similar. The Gold/Silver ratio, which shows the number of ounces of Silver needed to equal the value of one ounce of Gold, may help to determine the relative valuation between both metals. Some investors may consider a high ratio as an indicator that Silver is undervalued, or Gold is overvalued. On the contrary, a low ratio might suggest that Gold is undervalued relative to Silver.
Author

Christian Borjon Valencia
FXStreet
Markets analyst, news editor, and trading instructor with over 14 years of experience across FX, commodities, US equity indices, and global macro markets.


