Silver Price Forecast: XAG/USD slides further to $30.00 as US Dollar extends rally
- Silver price weakens as Trump’s victory is expected to boost US growth and consumer spending.
- The US Dollar rallies on expectations that the Fed could follow a slower policy-easing approach.
- Investors expect the Fed to cut interest rates by 25 bps in December.

Silver price (XAG/USD) falls further to near $30.20 in European trading hours on Tuesday. The white metal weakens as the US Dollar (USD) strengthens on expectations that President-elected Donald Trump’s policies will boost the United States (US) economic growth and inflationary pressures.
The US Dollar Index (DXY), which tracks the Greenback’s value against six major currencies, inches close to the key resistance of 106.00. The higher US Dollar makes the Silver price an expensive bet for investors. Meanwhile, 10-year US Treasury yields jump to near 4.37%. Higher yields on interest-bearing assets reduce the opportunity cost of holding an investment in non-yielding assets, such as Silver.
Trump vowed to raise import tariffs by 10% and lower corporate taxes in his election campaign, a move that will increase demand for domestic goods, boost labor demand and business investment, which will eventually prompt inflationary pressures and allow the Federal Reserve (Fed) to follow a more gradual rate-cut cycle.
In the December meeting, there is a 65% chance that the Fed will cut interest rates by 25 basis points (bps) to 4.25%-4.50%, according to the CME FedWatch tool.
Going forward, investors will focus on the US Consumer Price Index (CPI) data for October, which will be released on Wednesday for fresh interest rate guidance. Also, a slew of Fed officials, including Chair Jerome Powell, are set to speak this week.
Apart from the US Dollar’s strength, an absence of direct stimulus in the Chinese economic package to revive the economy has also weighed on the Silver price. Silver, as a metal, has applications in various industries associated with renewable energy and mining. A scenario of bleak growth in China weighs on the Silver price.
Silver technical analysis
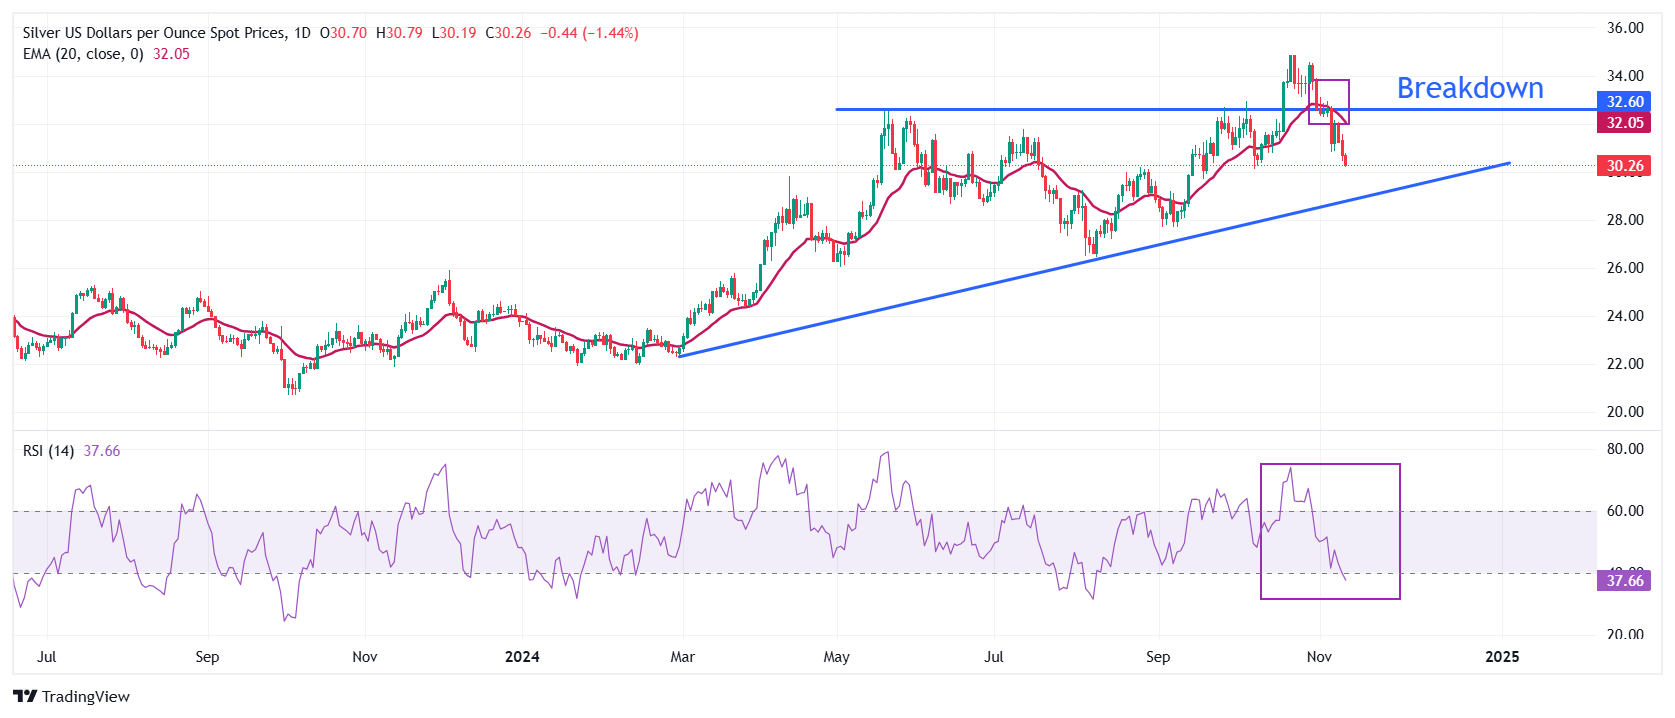
Silver price declines toward the upward-sloping trendline around $29.00, plotted from the February 28 low of $22.30. The white metal weakened after breaking below the horizontal support plotted from the May 21 high of $32.50.
The near-term trend of the Silver price has weakened as the 20-day Exponential Moving Average (EMA) starts declining, which trades around $30.26.
The 14-day Relative Strength Index (RSI) slides below 40.00. A bearish momentum will trigger if the RSI (14) sustains below the same.
Silver daily chart
Silver FAQs
Silver is a precious metal highly traded among investors. It has been historically used as a store of value and a medium of exchange. Although less popular than Gold, traders may turn to Silver to diversify their investment portfolio, for its intrinsic value or as a potential hedge during high-inflation periods. Investors can buy physical Silver, in coins or in bars, or trade it through vehicles such as Exchange Traded Funds, which track its price on international markets.
Silver prices can move due to a wide range of factors. Geopolitical instability or fears of a deep recession can make Silver price escalate due to its safe-haven status, although to a lesser extent than Gold's. As a yieldless asset, Silver tends to rise with lower interest rates. Its moves also depend on how the US Dollar (USD) behaves as the asset is priced in dollars (XAG/USD). A strong Dollar tends to keep the price of Silver at bay, whereas a weaker Dollar is likely to propel prices up. Other factors such as investment demand, mining supply – Silver is much more abundant than Gold – and recycling rates can also affect prices.
Silver is widely used in industry, particularly in sectors such as electronics or solar energy, as it has one of the highest electric conductivity of all metals – more than Copper and Gold. A surge in demand can increase prices, while a decline tends to lower them. Dynamics in the US, Chinese and Indian economies can also contribute to price swings: for the US and particularly China, their big industrial sectors use Silver in various processes; in India, consumers’ demand for the precious metal for jewellery also plays a key role in setting prices.
Silver prices tend to follow Gold's moves. When Gold prices rise, Silver typically follows suit, as their status as safe-haven assets is similar. The Gold/Silver ratio, which shows the number of ounces of Silver needed to equal the value of one ounce of Gold, may help to determine the relative valuation between both metals. Some investors may consider a high ratio as an indicator that Silver is undervalued, or Gold is overvalued. On the contrary, a low ratio might suggest that Gold is undervalued relative to Silver.
Author

Sagar Dua
FXStreet
Sagar Dua is associated with the financial markets from his college days. Along with pursuing post-graduation in Commerce in 2014, he started his markets training with chart analysis.


