Silver Price Forecast: XAG/USD reaches a fresh three-month high above $25.00
- XAG/USD rallies as US inflation shoots through the roof, its most significant jump in 30 years.
- XAG/USD spiked $0.80 as news headlines crossed the wires.
- US 5-year real yields measurement falls from -1.85% to -1.941%, weighing on the US dollar.

Silver (XAG/USD) price spiked higher as the Bureau of Labor Statistics (BLS) revealed that the Consumer Price Index for October, a US measurement of prices paid by consumers, expanded by 6.2% – higher than the September 5.4% jump in inflation, and the largest since 1990. That said, the non-yielding metal has advanced almost 3%, trading at $25.01 at the time of writing.
XAG/USD reacted with a price jump of $0.80, from $24.20 to $25.00, once the news crossed the wires. The bounce in prices left behind September and October highs at $24.87 and $24.82, respectively, which could now act as support areas going forward.
US Consumer Price Index rose by 6.2%, the most significant reading since 1990
In the US economic docket, the Bureau of Labor Statistics (BLS) revealed that the Consumer Price Index (CPI) surged 6.2% on a year-over-year basis, up from 5.4% in September, leaving behind estimations of 5.3% by economists. Further, the Core CPI reading, which excludes volatile items like energy and food, expanded by 4.6% in the same period, higher than the 4.8% foreseen by the market.
Meanwhile, the 10-year US T-bond benchmark note rose almost seven basis points, recovering some of its weekly losses, sitting at 1.517%, underpinning demand for the greenback. The US Dollar Index, a measure of the buck’s value against its peers, advanced 0.67%, to currently trade at 94.59.
But why do silver prices keep getting higher? The answer is that real yields, the difference of interest rates minus inflation, are dropping. The US 5-year TIPS, real yields measurement, has fallen from -1.85% to -1.941%, the second-lowest reading since July 2021, per Reuters.
XAG/USD Price Forecast: Technical outlook
Daily chart
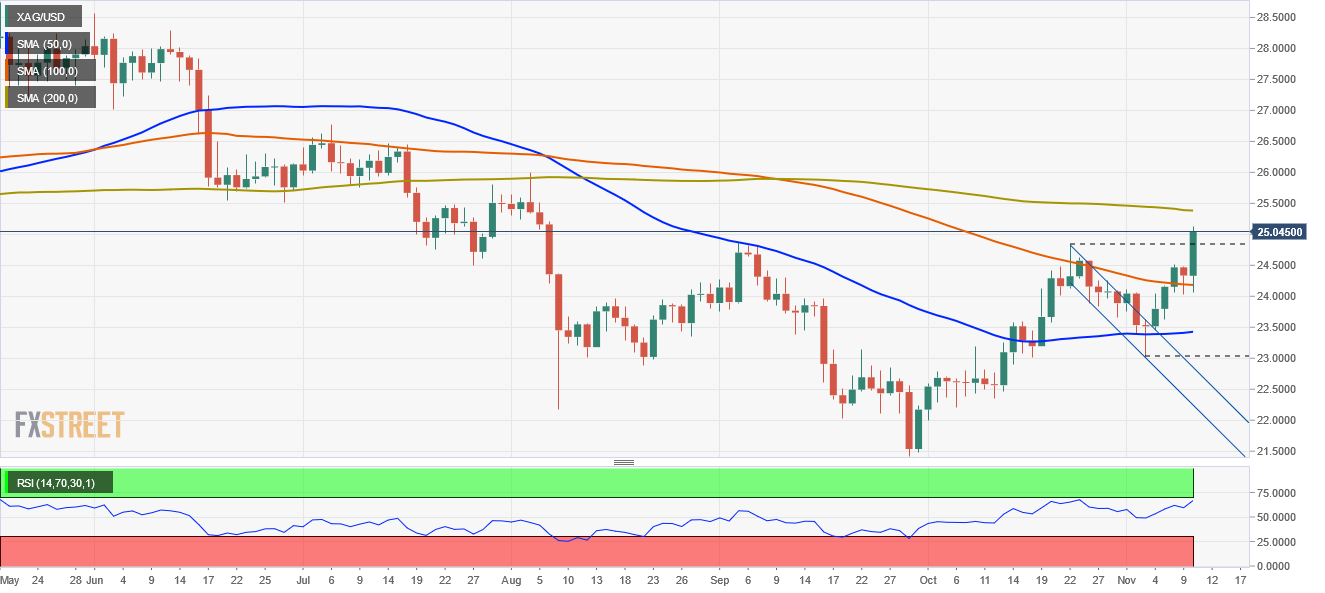
The white metal has a near-term upward bias, as witnessed by the shorter time-frame daily moving averages (DMA’s) below the spot price, but the 200-DMA sits at $25.38, which would be strong resistance for silver bulls to overcome. Despite the abovementioned, the Relative Strength Index (RSI) at 67 still has enough room left before reaching overbought conditions, indicating that XAG/USD could print another leg-up.
As mentioned in the previous paragraph, the 200-DMA at $25.38 would be the first resistance level in the outcome of another push higher. A breach above that level could open the door for the bulls to attack the $26.00 area, which would then expose the $27.00 figure to being broken.
Author

Christian Borjon Valencia
FXStreet
Markets analyst, news editor, and trading instructor with over 14 years of experience across FX, commodities, US equity indices, and global macro markets.


