Silver Price Forecast: XAG/USD rallies as Trump’s tariffs hammer US Dollar
- Silver climbs to $32.37, nearing February 7 high of $32.64.
- US Dollar Index drops 0.85% as Trump pushes reciprocal tariffs.
- Hot PPI data, strong labor market fuel inflation concerns.

Silver's price advanced for the second consecutive day, registering gains of over 0.48%. It trades at $32.37 a troy ounce and is about to test the key resistance level at $32.64, the February 7 swing high.
XAG/USD eyes key resistance as DXY plunges to two-week low
Tariffs are the name of the game and the most important driver during the North American session. US President Donald Trump ordered advisors to devise ‘reciprocal’ tariffs against US trade partners.
After the headlines crossed the screens, the Greenback depreciated sharply against a basket of six currencies known as the US Dollar Index (DXY). The DXY plummets over 0.85%, down at 107.04, near two-week lows.
In the meantime, the US Producer Price Index (PPI) for January rose by 0.4% month-over-month (MoM), surpassing the anticipated 0.3% and showing a slight decline from December's 0.5%. Year-over-year (YoY), the PPI held steady at 3.5%, exceeding expectations.
At the same time, core PPI, which excludes volatile food and energy prices, also reported an increase, with monthly figures climbing by the expected 0.3%. Over the twelve months to January, the core PPI rose by 3.6%, 0.3 percentage points above the forecasted 3.3%.
Other data showed the labor market remains strong after Initial Jobless Claims for the week ending February 8 dropped to 213K, below the projected 215K and down from the prior week's 220K.
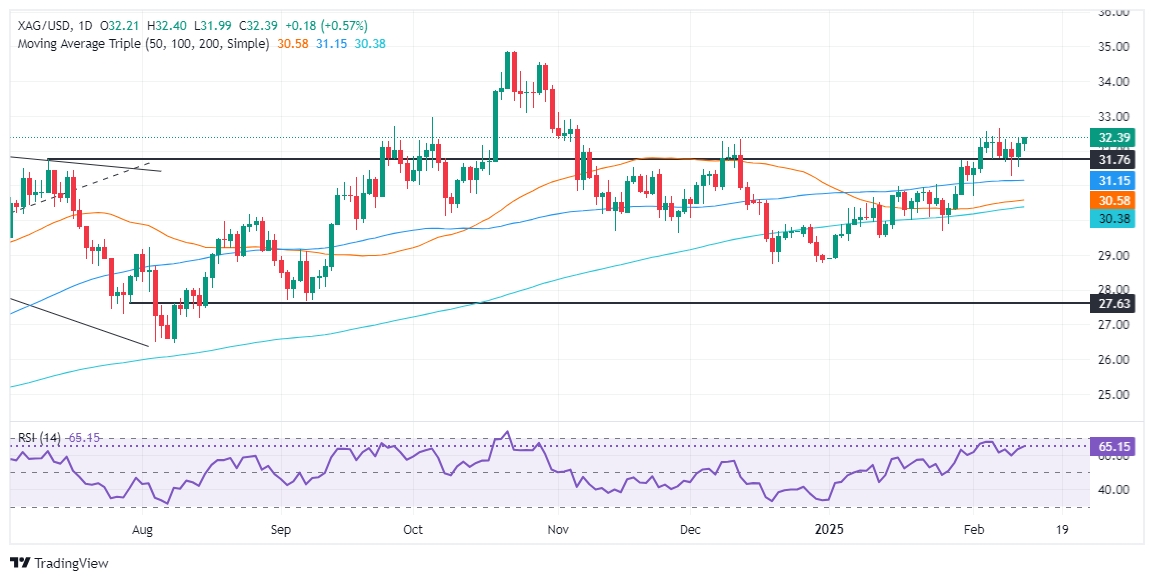
XAG/USD Price Forecast: Technical outlook
From a technical standpoint, Silver is upwardly biased but about to face stir resistance at $32.64. The Relative Strength Index (RSI) shows that buyers are gathering some steam, and if they clear the previously mentioned resistance level, the next ceiling level would be $33.00.
A breach of the latter will expose the October 31 peak at $33.89, followed by the October 29 high at $3454.
Conversely, if Silver falls beneath $32.00, the first key support would be the 100-day Simple Moving Average (SMA) at $31.12.
Silver FAQs
Silver is a precious metal highly traded among investors. It has been historically used as a store of value and a medium of exchange. Although less popular than Gold, traders may turn to Silver to diversify their investment portfolio, for its intrinsic value or as a potential hedge during high-inflation periods. Investors can buy physical Silver, in coins or in bars, or trade it through vehicles such as Exchange Traded Funds, which track its price on international markets.
Silver prices can move due to a wide range of factors. Geopolitical instability or fears of a deep recession can make Silver price escalate due to its safe-haven status, although to a lesser extent than Gold's. As a yieldless asset, Silver tends to rise with lower interest rates. Its moves also depend on how the US Dollar (USD) behaves as the asset is priced in dollars (XAG/USD). A strong Dollar tends to keep the price of Silver at bay, whereas a weaker Dollar is likely to propel prices up. Other factors such as investment demand, mining supply – Silver is much more abundant than Gold – and recycling rates can also affect prices.
Silver is widely used in industry, particularly in sectors such as electronics or solar energy, as it has one of the highest electric conductivity of all metals – more than Copper and Gold. A surge in demand can increase prices, while a decline tends to lower them. Dynamics in the US, Chinese and Indian economies can also contribute to price swings: for the US and particularly China, their big industrial sectors use Silver in various processes; in India, consumers’ demand for the precious metal for jewellery also plays a key role in setting prices.
Silver prices tend to follow Gold's moves. When Gold prices rise, Silver typically follows suit, as their status as safe-haven assets is similar. The Gold/Silver ratio, which shows the number of ounces of Silver needed to equal the value of one ounce of Gold, may help to determine the relative valuation between both metals. Some investors may consider a high ratio as an indicator that Silver is undervalued, or Gold is overvalued. On the contrary, a low ratio might suggest that Gold is undervalued relative to Silver.
Author

Christian Borjon Valencia
FXStreet
Markets analyst, news editor, and trading instructor with over 14 years of experience across FX, commodities, US equity indices, and global macro markets.


