|

Silver Price Forecast: XAG/USD rallies above $22.00 on broad US dollar weakness

  • XAG/USD soars as the US bond yields drop two basis points, sitting around 1.52%.
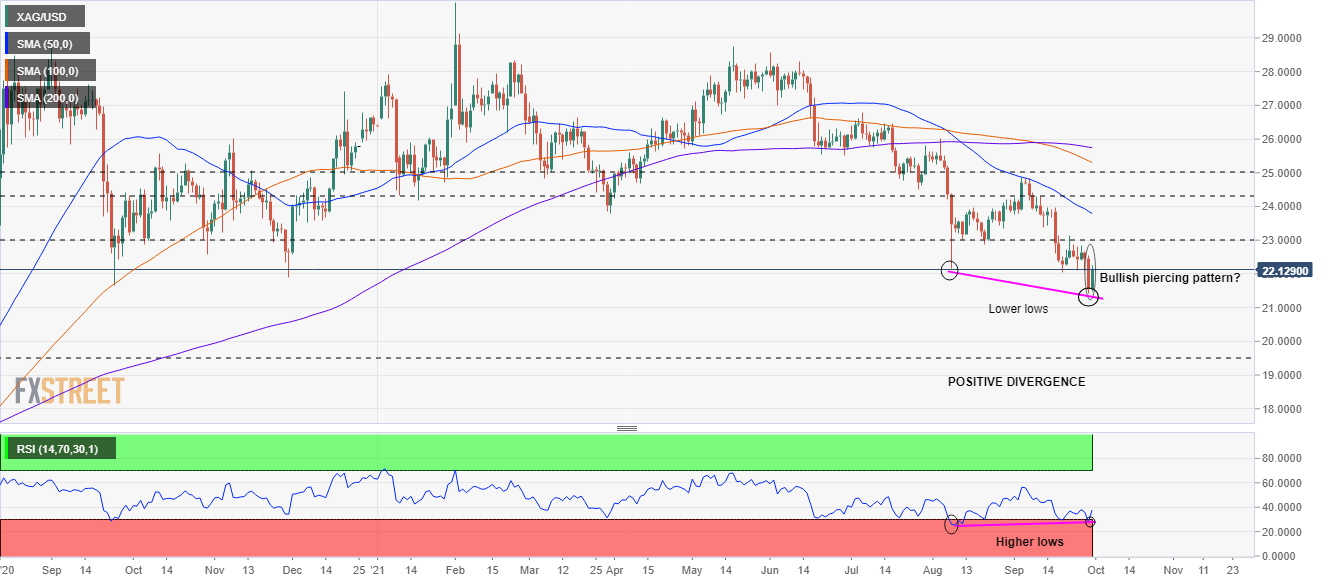
  • A bullish piercing pattern in the daily chart suggests that silver is poised for a rebound.
  • Positive divergence in a daily chart supports XAG/USD prospects of higher prices.

Silver (XAG/USD) is trimming two-day losses, is climbing 3.05% in the day, trading at $22.17 at the time of writing. The rally in XAG/USD is underpinned, by falling US bond yields, with the 10-year benchmark note coupon sitting at 1.520%, down almost two basis points (bps).

The US Dollar Index, which tracks the greenback’s performance against a basket of six currencies, is sliding for the first day out of two, 0.20%, currently at 94.22.

XAG/USD Price Forecast: Technical outlook

Daily chart

XAG/USD price action depicts some confluences. First, the price action of the last two days looks like a bullish piercing pattern, suggesting upside bias. Second, the price action has printed successive lower lows, that coupled with the Relative Strength Index, consecutive higher-lows, portrays a positive divergence that could propel the white-metal for higher prices.

The first supply zone would be $23.00. A break of the latter would expose the 50-day moving average (DMA) at $23.79, followed by the September 3 high at $24.86

On the other hand, failure at $22.00 could pave the way for further losses. The first demand zone would be $21.00. A break of that level could push XAG/USD to the psychological $20.00, followed by July 15, 2020, high at $19.48.

The Relative Strength Index (RSI) is at 38, aiming higher, suggest an easing downward pressure. While RSI remains below the 50-midline, the downtrend could resume; however, the positive divergence could motivate buyers to push prices up. Caution is warranted.

ADDITIONAL LEVELS TO WATCH

XAG/USD

Overview
Today last price22.16
Today Daily Change0.62
Today Daily Change %2.88
Today daily open21.54
 
Trends
Daily SMA2023.26
Daily SMA5023.86
Daily SMA10025.35
Daily SMA20025.76
 
Levels
Previous Daily High22.55
Previous Daily Low21.42
Previous Weekly High23.15
Previous Weekly Low22.04
Previous Monthly High26
Previous Monthly Low22.17
Daily Fibonacci 38.2%21.85
Daily Fibonacci 61.8%22.12
Daily Pivot Point S121.12
Daily Pivot Point S220.71
Daily Pivot Point S319.99
Daily Pivot Point R122.25
Daily Pivot Point R222.97
Daily Pivot Point R323.38

Author

Christian Borjon Valencia

Christian Borjon began his career as a retail trader in 2010, mainly focused on technical analysis and strategies around it. He started as a swing trader, as he used to work in another industry unrelated to the financial markets.

More from Christian Borjon Valencia
Share:

Markets move fast. We move first.

Orange Juice Newsletter brings you expert driven insights - not headlines. Every day on your inbox.

By subscribing you agree to our Terms and conditions.

Editor's Picks

EUR/USD stays defensive below 1.1750 as USD finds its feet

EUR/USD kicks off the new week on a softer note, holding below 1.1750 in European trading on Monday. The pair faces challenges due to a pause in the US Dollar downtrend, with traders shifting their focus to the delayed US Nonfarm Payrolls and CPI data for fresh directives. The ECB policy decision is also eagerly awaited. 

GBP/USD holds steady above 1.3350 as traders await key data and BoE

GBP/USD remains on the back foot above 1.3350 in the European session on Monday, though it lacks bearish conviction and holds above the key 200-day SMA support. The US Dollar holds its recovery mode ahead of key data releases, while the Pound Sterling faces headwinds from the expected BoE rate cut this week. 

Gold climbs to seven-week highs on Fed rate cut bets, safe-haven demand

Gold price rises to seven-week highs to near $4,350 during the early European trading hours on Monday. The precious metal extends its upside amid the prospect of interest rate cuts by the US Fed next year. Lower interest rates could reduce the opportunity cost of holding Gold, supporting the non-yielding precious metal.

Solana consolidates as spot ETF inflows near $1 billion signal institutional dip-buying

Solana price hovers above $131 at the time of writing on Monday, nearing the upper boundary of a falling wedge pattern, awaiting a decisive breakout. On the institutional side, demand for spot Solana Exchange-Traded Funds remained firm, pushing total assets under management to nearly $1 billion since launch. 

Big week ends with big doubts

The S&P 500 continued to push higher yesterday as the US 2-year yield wavered around the 3.50% mark following a Federal Reserve (Fed) rate cut earlier this week that was ultimately perceived as not that hawkish after all. The cut is especially boosting the non-tech pockets of the market.

Solana Price Forecast: SOL consolidates as spot ETF inflows near $1 billion signal institutional dip-buying

Solana (SOL) price hovers above $131 at the time of writing on Monday, nearing the upper boundary of a falling wedge pattern, awaiting a decisive breakout.