Silver Price Forecast: XAG/USD gives up gains after upbeat US ADP Employment data
- Silver price gives up a majority of intraday gains after the release of the upbeat US private employment data for January.
- Strong labor demand would force the Fed to maintain the status quo for longer.
- Investors expect the trade war would be limited between the US and China.

Silver price (XAG/USD) surrenders almost its entire intraday gains and falls back to near $32.00 in Wednesday’s North American session. The white metal faces selling pressure as the US Dollar (USD) attempts to gain ground on the back of upbeat United States (US) ADP Employment Change data for January. The US Dollar Index (DXY), which tracks the Greenback’s value against six major currencies, finds buyers’ demand near 107.40 but is still over 0.4% down intraday.
The agency reported that 183K new workers were hired by the private sector last month, which were significantly higher than estimates of 150K, and the prior release of 176K, revised significantly higher from 122K.
Signs of strong labor demand would force Federal Reserve (Fed) officials to keep interest rates at their current levels for longer. Last week, Fed Chair Jerome Powell said that they will make monetary policy adjustments only after seeing “real progress in inflation or at least some weakness in labor market”. Technically, the Fed’s stance for keeping interest rates steady weighs on precious metals, such as Silver.
Meanwhile, investors are also doubting the Silver outlook amid receding fears of a lethal global trade war. Market participants expect the trade war to remain restricted between China and the US. Investors have interpreted President Donald trump’s tariff agenda as more a negotiating tool after his decision of suspending the order of imposing 25% tariffs on Canada and Mexico.
While 10% tariffs on China have come into effect from February, and in retaliation, China has also imposed levies on the US.
Silver technical analysis
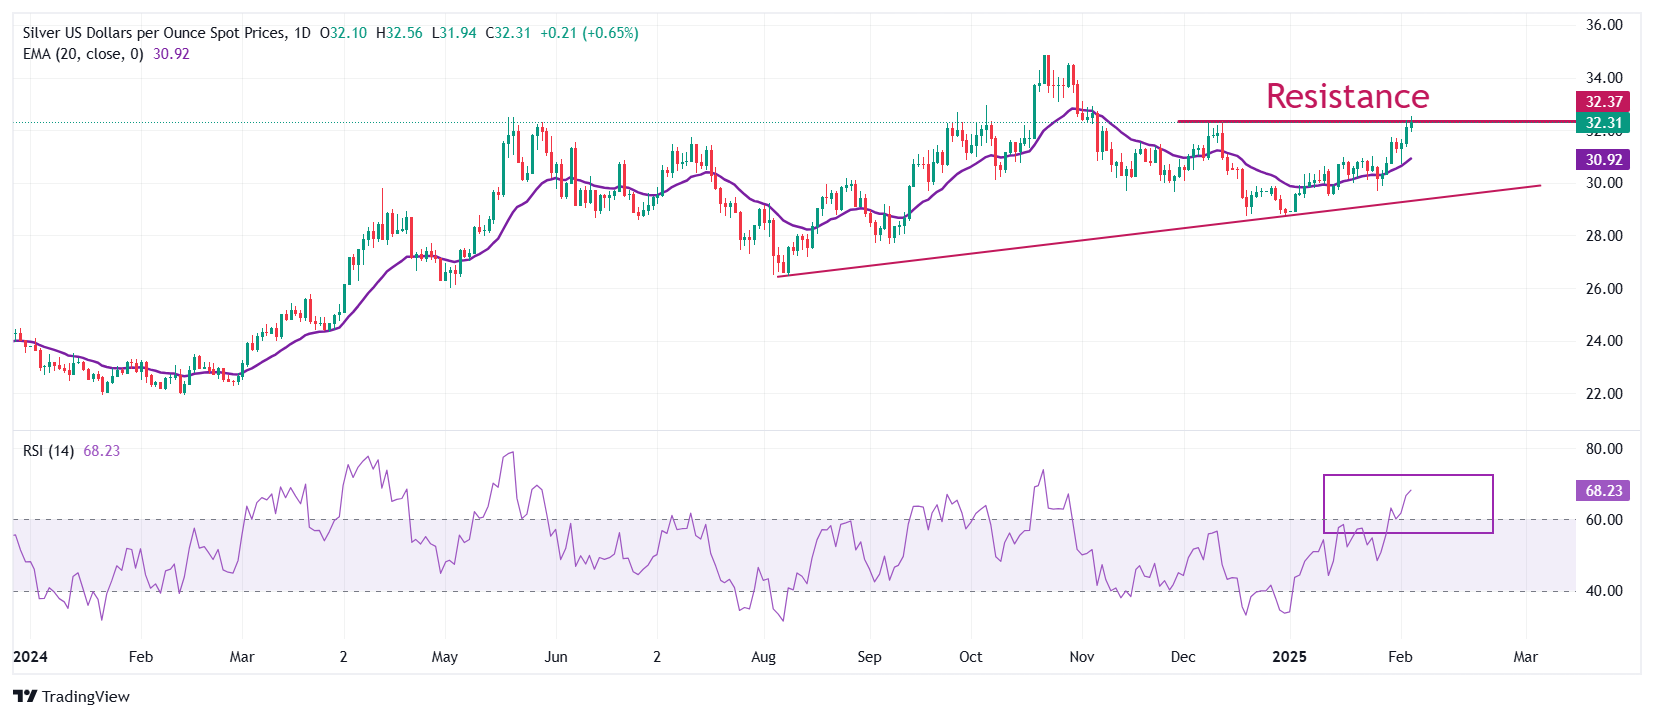
Silver price strives to break above the immediate resistance of $32.50, which is plotted from the December 9 high. The outlook of the white metal remains bullish as the 20-day Exponential Moving Average (EMA) is sloping higher near $30.90.
The 14-day Relative Strength Index (RSI) oscillates in the 60.00-80.00 range, suggesting that the momentum is bullish.
Looking down, the upward-sloping trendline from the August 8 low of $26.45 will be the key support for the Silver price around $29.50. While, the October 31 high of $33.90 will be the key barrier.
Silver daily chart
Silver FAQs
Silver is a precious metal highly traded among investors. It has been historically used as a store of value and a medium of exchange. Although less popular than Gold, traders may turn to Silver to diversify their investment portfolio, for its intrinsic value or as a potential hedge during high-inflation periods. Investors can buy physical Silver, in coins or in bars, or trade it through vehicles such as Exchange Traded Funds, which track its price on international markets.
Silver prices can move due to a wide range of factors. Geopolitical instability or fears of a deep recession can make Silver price escalate due to its safe-haven status, although to a lesser extent than Gold's. As a yieldless asset, Silver tends to rise with lower interest rates. Its moves also depend on how the US Dollar (USD) behaves as the asset is priced in dollars (XAG/USD). A strong Dollar tends to keep the price of Silver at bay, whereas a weaker Dollar is likely to propel prices up. Other factors such as investment demand, mining supply – Silver is much more abundant than Gold – and recycling rates can also affect prices.
Silver is widely used in industry, particularly in sectors such as electronics or solar energy, as it has one of the highest electric conductivity of all metals – more than Copper and Gold. A surge in demand can increase prices, while a decline tends to lower them. Dynamics in the US, Chinese and Indian economies can also contribute to price swings: for the US and particularly China, their big industrial sectors use Silver in various processes; in India, consumers’ demand for the precious metal for jewellery also plays a key role in setting prices.
Silver prices tend to follow Gold's moves. When Gold prices rise, Silver typically follows suit, as their status as safe-haven assets is similar. The Gold/Silver ratio, which shows the number of ounces of Silver needed to equal the value of one ounce of Gold, may help to determine the relative valuation between both metals. Some investors may consider a high ratio as an indicator that Silver is undervalued, or Gold is overvalued. On the contrary, a low ratio might suggest that Gold is undervalued relative to Silver.
Author

Sagar Dua
FXStreet
Sagar Dua is associated with the financial markets from his college days. Along with pursuing post-graduation in Commerce in 2014, he started his markets training with chart analysis.


