- Silver price faces challenges as daily chart analysis suggests a bearish bias.
- The MACD line has crossed below the signal line, indicating potential downward pressure on the Silver price.
- Silver price may navigate the area around the lower boundary of the descending channel at the $27.70 level.
Silver price (XAG/USD) extends its losses for the third consecutive day, trading around $28.50 per troy ounce during Tuesday’s Asian hours. The analysis of the daily chart shows that the pair is positioned within a descending channel, suggesting a bearish bias. Additionally, the 14-day Relative Strength Index (RSI) is positioned below the 50 level, confirming a bearish trend.
The momentum indicator Moving Average Convergence Divergence (MACD) line has crossed below the signal line, it is generally considered a bearish signal. This crossover suggests that the momentum is shifting from bullish to bearish, indicating potential downward pressure on the Silver's price.
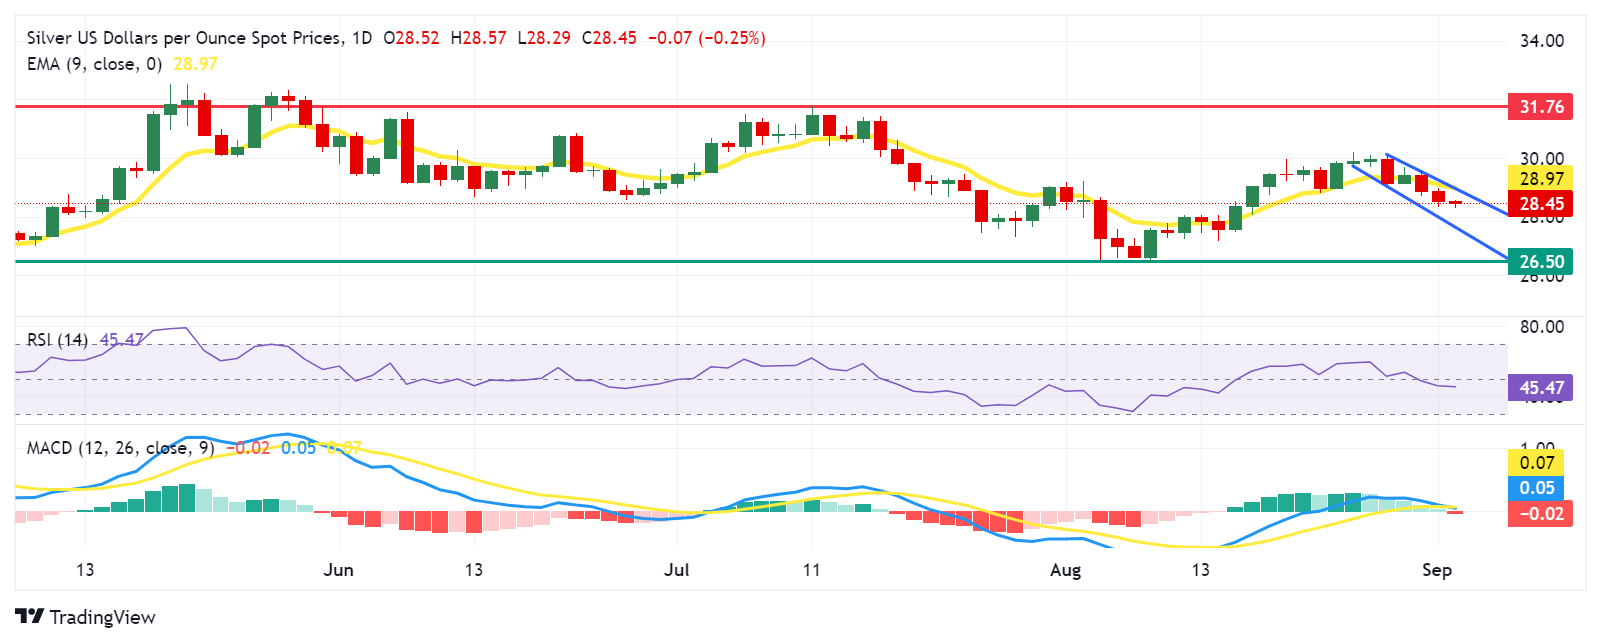
In terms of support, the Silver price may navigate the region around the lower boundary of the descending channel at the $27.70 level. A break below this level could strengthen the bearish bias and drive the asset’s price toward throwback support $26.50 level.
On the upside, the Silver price tests an immediate resistance at the upper boundary of the descending channel around the nine-day Exponential Moving Average (EMA) at the $28.97 level. A breakthrough above the latter could lead the XAG/USD pair to explore the region around the three-month high at the $31.76 level.
XAG/USD: Daily Chart
Silver FAQs
Silver is a precious metal highly traded among investors. It has been historically used as a store of value and a medium of exchange. Although less popular than Gold, traders may turn to Silver to diversify their investment portfolio, for its intrinsic value or as a potential hedge during high-inflation periods. Investors can buy physical Silver, in coins or in bars, or trade it through vehicles such as Exchange Traded Funds, which track its price on international markets.
Silver prices can move due to a wide range of factors. Geopolitical instability or fears of a deep recession can make Silver price escalate due to its safe-haven status, although to a lesser extent than Gold's. As a yieldless asset, Silver tends to rise with lower interest rates. Its moves also depend on how the US Dollar (USD) behaves as the asset is priced in dollars (XAG/USD). A strong Dollar tends to keep the price of Silver at bay, whereas a weaker Dollar is likely to propel prices up. Other factors such as investment demand, mining supply – Silver is much more abundant than Gold – and recycling rates can also affect prices.
Silver is widely used in industry, particularly in sectors such as electronics or solar energy, as it has one of the highest electric conductivity of all metals – more than Copper and Gold. A surge in demand can increase prices, while a decline tends to lower them. Dynamics in the US, Chinese and Indian economies can also contribute to price swings: for the US and particularly China, their big industrial sectors use Silver in various processes; in India, consumers’ demand for the precious metal for jewellery also plays a key role in setting prices.
Silver prices tend to follow Gold's moves. When Gold prices rise, Silver typically follows suit, as their status as safe-haven assets is similar. The Gold/Silver ratio, which shows the number of ounces of Silver needed to equal the value of one ounce of Gold, may help to determine the relative valuation between both metals. Some investors may consider a high ratio as an indicator that Silver is undervalued, or Gold is overvalued. On the contrary, a low ratio might suggest that Gold is undervalued relative to Silver.
Information on these pages contains forward-looking statements that involve risks and uncertainties. Markets and instruments profiled on this page are for informational purposes only and should not in any way come across as a recommendation to buy or sell in these assets. You should do your own thorough research before making any investment decisions. FXStreet does not in any way guarantee that this information is free from mistakes, errors, or material misstatements. It also does not guarantee that this information is of a timely nature. Investing in Open Markets involves a great deal of risk, including the loss of all or a portion of your investment, as well as emotional distress. All risks, losses and costs associated with investing, including total loss of principal, are your responsibility. The views and opinions expressed in this article are those of the authors and do not necessarily reflect the official policy or position of FXStreet nor its advertisers. The author will not be held responsible for information that is found at the end of links posted on this page.
If not otherwise explicitly mentioned in the body of the article, at the time of writing, the author has no position in any stock mentioned in this article and no business relationship with any company mentioned. The author has not received compensation for writing this article, other than from FXStreet.
FXStreet and the author do not provide personalized recommendations. The author makes no representations as to the accuracy, completeness, or suitability of this information. FXStreet and the author will not be liable for any errors, omissions or any losses, injuries or damages arising from this information and its display or use. Errors and omissions excepted.
The author and FXStreet are not registered investment advisors and nothing in this article is intended to be investment advice.
Recommended content
Editors’ Picks

EUR/USD stays in daily range near 1.1050 after US data
EUR/USD trades in a narrow channel at around 1.1050 in the second half of the day on Tuesday. The data from the US showed that the ISM Manufacturing PMI recovered slightly to 47.2 in August, failing to provide an additional boost to the USD.

GBP/USD closes in on 1.3100 following US PMI data
GBP/USD stays under bearish pressure on Tuesday and closes in on 1.3100. Although the US Dollar struggles to benefit from the ISM Manufacturing PMI data for August, the risk-averse market atmosphere doesn't allow the pair to stage a rebound.

Gold extends correction, trades below $2,480
Gold continues to stretch lower on Tuesday and trades at its weakest level in nearly two weeks below $2,480. Although the US Treasury bond yields decline toward 3.8%, XAU/USD struggles to find a foothold amid persistent US Dollar resilience.

Crypto Today: Bitcoin, Ethereum lag, XRP back above $0.56 with major announcements in Korea, Japan
Bitcoin trades at $59,000, Ethereum hovers around $2,500, both note a slight decline in price on Tuesday. XRP tests $0.57 resistance, adds more than 0.5% to its value on the day.

Week ahead: US labour data and the BoC rate announcement in focus
With US Federal Reserve Chair Jerome Powell’s recent speech at the Jackson Hole Symposium confirming that it is time to begin easing policy as well as underlining the importance of the jobs market, this week’s jobs data may help determine how the Fed approaches its easing cycle.

Moneta Markets review 2024: All you need to know
VERIFIED In this review, the FXStreet team provides an independent and thorough analysis based on direct testing and real experiences with Moneta Markets – an excellent broker for novice to intermediate forex traders who want to broaden their knowledge base.