Silver Price Forecast: XAG/USD advances to near $32.50 as USD Index dives on US economic concerns
- Silver price gains sharply to near $32.50 amid weakness in the US Dollar.
- Escalating US economic concerns have kept the US Dollar on the backfoot.
- Investors await the US CPI data for fresh cues on the interest rate outlook.
Silver price (XAG/USD) jumps sharply to near $32.50 in Tuesday’s European session. The white metal strengthens as the US Dollar (USD) faces a sharp sell-off, with investors turning cautious over the United States (US) economic outlook due to President Donald Trump’s tariff agenda. The US Dollar Index (DXY), which tracks the Greenback’s value against six major currencies, slumps to near 103.35, the lowest level seen in four months. The lower US Dollar makes precious metals, such as Silver, more attractive to investors.
Market participants worry that tariff policies by President Trump would result in an economic slowdown in the US. On Friday, Trump said, "There is a period of transition because what we are doing is very big.” Historically, periods of transition result in economic turbulence in the short term. Signs of heightened economic tensions improve the safe-haven demand for precious metals, such as Silver.
Meanwhile, investors await the US Consumer Price Index (CPI) data for February, which will be released on Wednesday. Investors will pay close attention to the US inflation data as it will influence market speculation for the Federal Reserve’s (Fed) monetary policy outlook. The US CPI data is estimated to have grown at a slower pace. Signs of a slowdown in inflationary pressures would boost market expectations that the Fed will cut interest rates in a May policy meeting. The likelihood for the Fed to cut interest rates in May has increased to 51% from 37% a day ago, according to the CME FedWatch tool. The scenario of lower interest rates bodes well for non-yielding assets, such as Silver.
Silver technical analysis
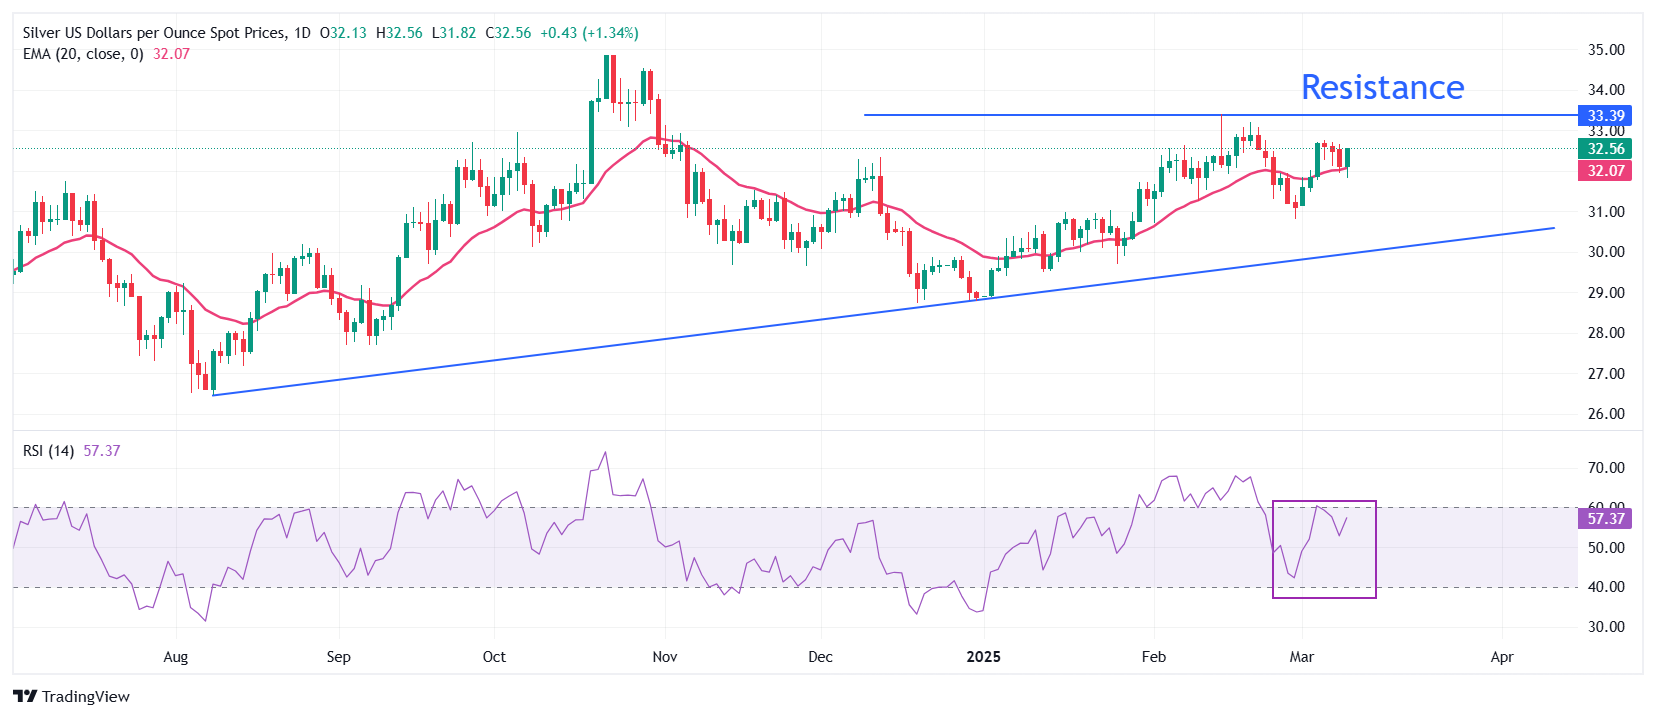
Silver price strives to revisit the key resistance of $33.40 plotted from the February 14 high. The 20-day Exponential Moving Average (EMA) near $32.07, continues to support the Silver price.
The 14-day Relative Strength Index (RSI) oscillates inside the 40.00-60.00 range, suggesting a sideways trend.
Looking down, the upward-sloping trendline from the August 8 low of $26.45 will act as key support for the Silver price around $30.00. While, the October 22 high of $34.87 will be the key barrier.
Silver daily chart
Silver FAQs
Silver is a precious metal highly traded among investors. It has been historically used as a store of value and a medium of exchange. Although less popular than Gold, traders may turn to Silver to diversify their investment portfolio, for its intrinsic value or as a potential hedge during high-inflation periods. Investors can buy physical Silver, in coins or in bars, or trade it through vehicles such as Exchange Traded Funds, which track its price on international markets.
Silver prices can move due to a wide range of factors. Geopolitical instability or fears of a deep recession can make Silver price escalate due to its safe-haven status, although to a lesser extent than Gold's. As a yieldless asset, Silver tends to rise with lower interest rates. Its moves also depend on how the US Dollar (USD) behaves as the asset is priced in dollars (XAG/USD). A strong Dollar tends to keep the price of Silver at bay, whereas a weaker Dollar is likely to propel prices up. Other factors such as investment demand, mining supply – Silver is much more abundant than Gold – and recycling rates can also affect prices.
Silver is widely used in industry, particularly in sectors such as electronics or solar energy, as it has one of the highest electric conductivity of all metals – more than Copper and Gold. A surge in demand can increase prices, while a decline tends to lower them. Dynamics in the US, Chinese and Indian economies can also contribute to price swings: for the US and particularly China, their big industrial sectors use Silver in various processes; in India, consumers’ demand for the precious metal for jewellery also plays a key role in setting prices.
Silver prices tend to follow Gold's moves. When Gold prices rise, Silver typically follows suit, as their status as safe-haven assets is similar. The Gold/Silver ratio, which shows the number of ounces of Silver needed to equal the value of one ounce of Gold, may help to determine the relative valuation between both metals. Some investors may consider a high ratio as an indicator that Silver is undervalued, or Gold is overvalued. On the contrary, a low ratio might suggest that Gold is undervalued relative to Silver.
Author

Sagar Dua
FXStreet
Sagar Dua is associated with the financial markets from his college days. Along with pursuing post-graduation in Commerce in 2014, he started his markets training with chart analysis.


