|

Silver Price Forecast: Silver finds temporary support at Fibonacci level, RSI oversold

  • Silver is in a short-term downtrend after rolling over at the late-August high. 
  • The price has found support from a key Fibonacci retracement and is oversold, indicating the risk of a correction.

Silver (XAG/USD) has established a sequence of falling peaks and troughs on the 4-hour chart since it rolled over at the August 26 high. This suggests the precious metal is in a new short-term downtrend, and given that “the trend is your friend,” it will continue lower.

Silver 4-hour Chart 

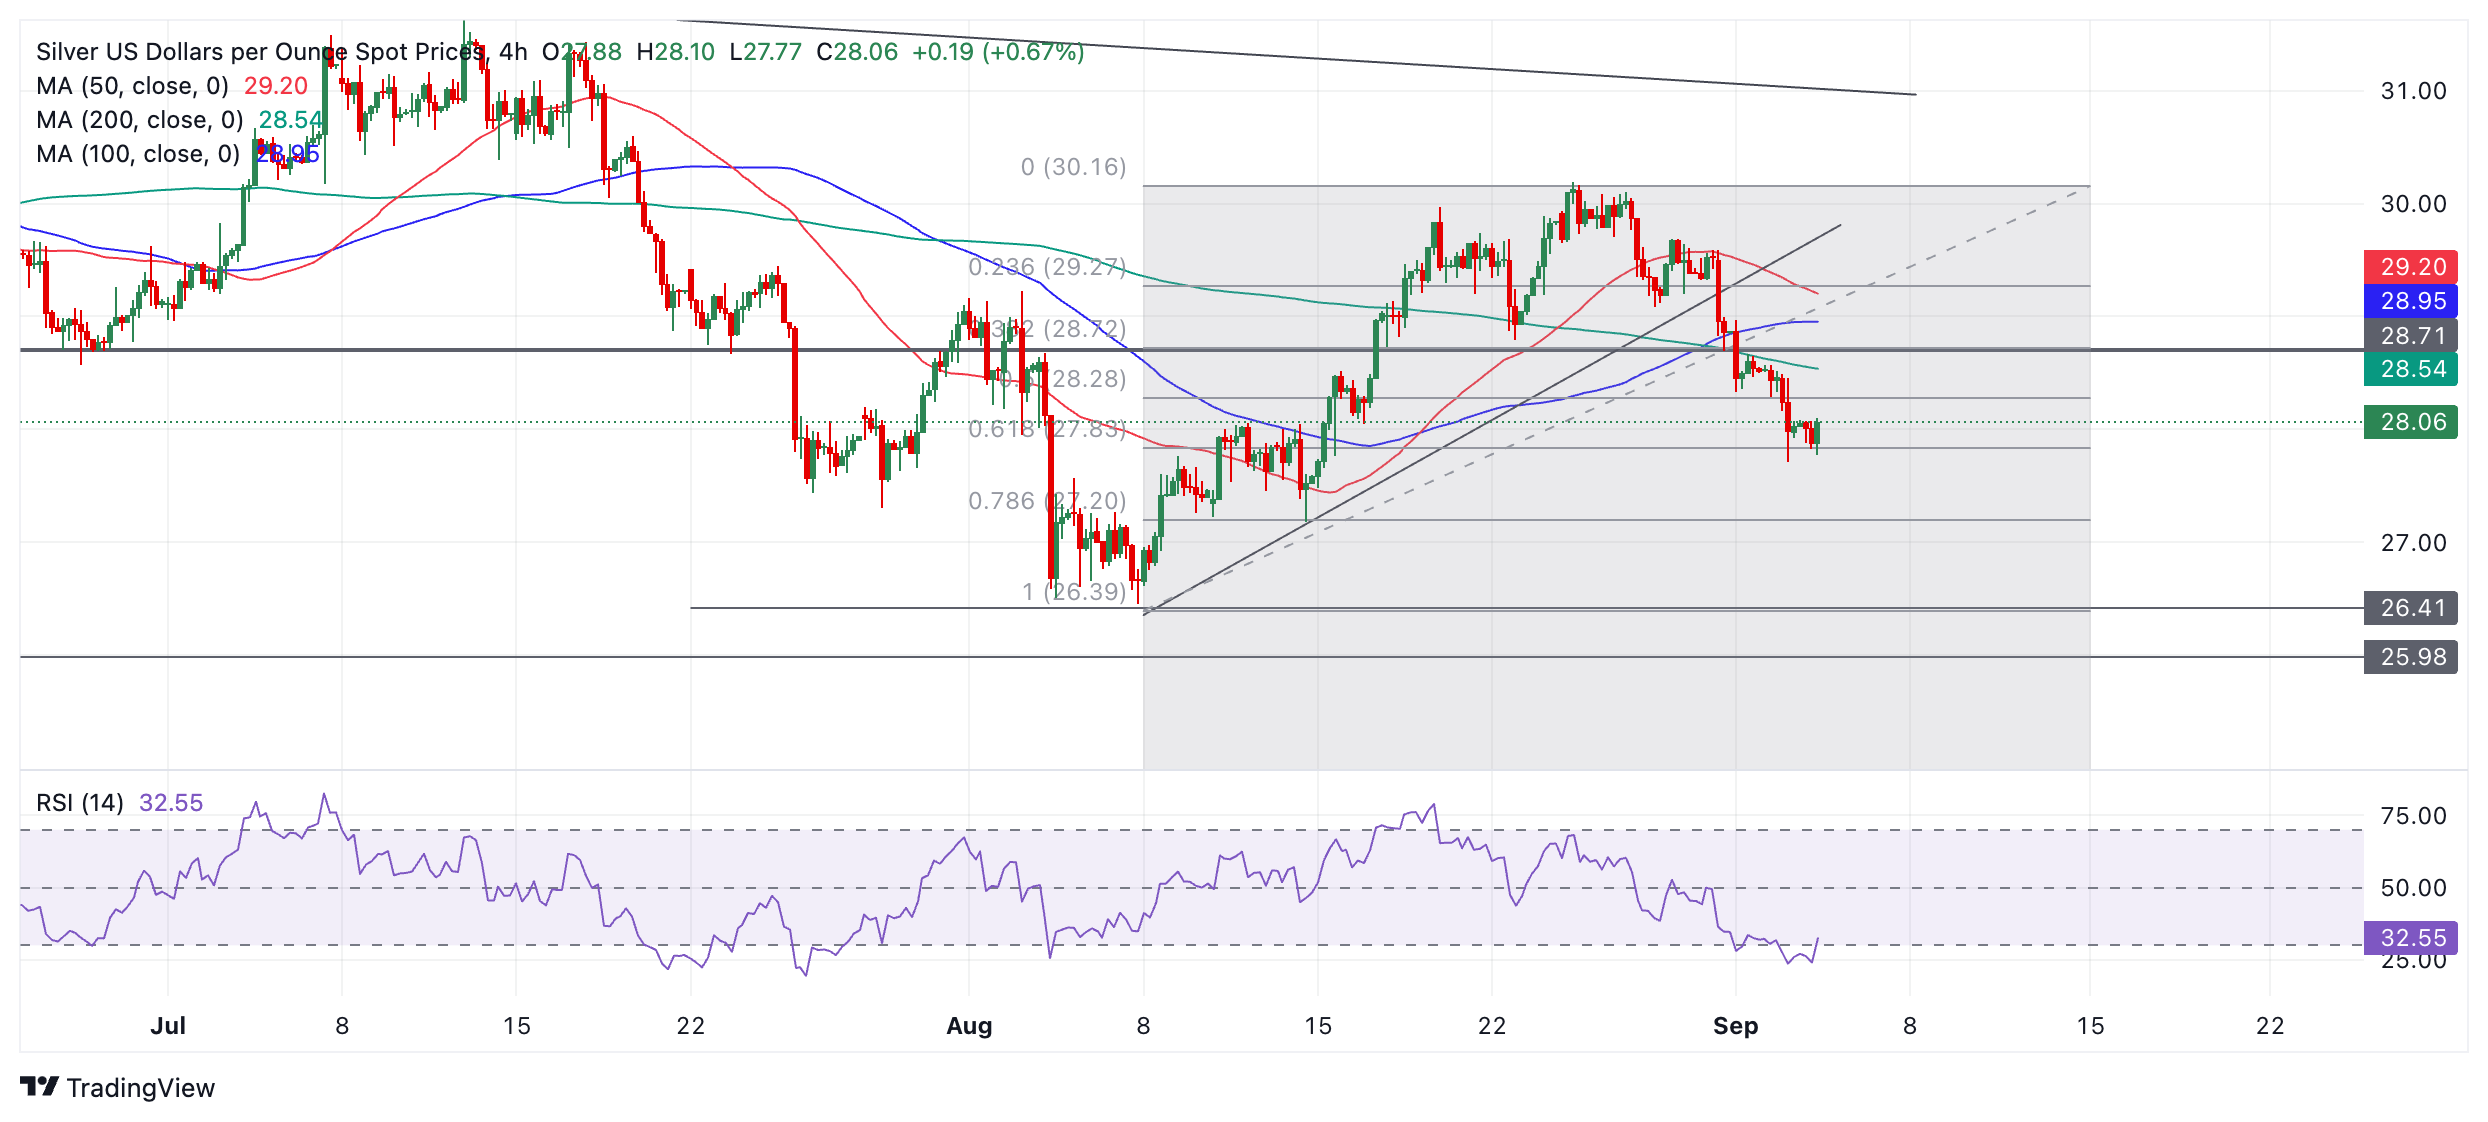
Silver is currently finding support at a key level – the 0.618 Fibonacci ratio retracement of the August rally. 

The Relative Strength Index (RSI) momentum indicator has fallen into oversold territory, and although it is shown exiting oversold on the current bar, it is not possible to tell whether it will close that way until the 4-hour period finishes. If it does rise out of oversold it will give a buy signal and, taken together with the support from the Fibonacci retracement, could indicate a temporary bottom in the downtrend. 

If a correction higher unfolds it will probably meet resistance between $28.28 (the 0.50 Fib retracement) and $28.33 (September 2 swing low). Given the trend is down it would be expected to resume its decline thereafter. 

In any case, a break below $27.71 (September 3 low) would produce a lower low and extend the downtrend. The next target is the August low at $26.41.  

The trend on the medium and longer-term charts is unclear – possibly sideways – indicating little directional bias from higher time frames.

Author

Joaquin Monfort

Joaquin Monfort is a financial writer and analyst with over 10 years experience writing about financial markets and alt data. He holds a degree in Anthropology from London University and a Diploma in Technical analysis.

More from Joaquin Monfort
Share:

Editor's Picks

EUR/USD flirts with yearly lows in the sub-1.1600 area

EUR/USD adds to Monday’s heavy losses and breaks below the key 1.1600 support on Tuesday, putting the YTD lows around 1.1570 to the test. The pair’s deep pullback comes as the US Dollar extend its strong bounce, always propped up by the intense  flight-to-safety environment.

GBP/USD attacks 1.3300, refreshing three-month lows

GBP/USD is deep in the red near 1.3300, accelerating its downside to renew three-month lows in European trading on Tuesday. The ongoing escalation in the Iran war, combined with rising Oil prices, weighs negatively on the higher-yielding Pound Sterling as the US Dollar capitalizes on increased haven demand.

Gold remains offered around $5,170

Gold comes under renewed and marked selling pressure on Tuesday, hovering around the $5,170 mark per troy ounce and reversing four consecutive daily advances. The yellow metal’s bearish tone comes on the back of the increasing demand for the Greenback at the time when investors continue to trim bets on further Fed rate cuts.

Crypto Today: Bitcoin, Ethereum, XRP pull back as sentiment remains in extreme market fear

The cryptocurrency market is broadly in the red on Tuesday as the Middle East grapples with an escalating war. Bitcoin (BTC) is in a pullback, trading below $67,000 at the time of writing, and most altcoins follow suit.

Middle East conflict ramps up a gear as energy price spike rips through markets

It’s another risk off day as geopolitical headwinds continue to batter financial markets. Although markets calmed during the US session and US stocks managed to post gains on Monday, this has not fed through to the European session, and stocks and bonds are sharply lower for a second day.

Hyperliquid Price Forecast: HYPE rises on commodities demand amid US-Iran war

Hyperliquid (HYPE) steadies above $33 at press time on Tuesday, marking its fourth consecutive day of recovery in a broadly volatile market due to the ongoing US-Israel strikes on Iran.