|

Silver Price Analysis: XAG/USD struggles to make it through $22.80 confluence resistance

Silver witnessed a modest intraday pullback from the $22.80 confluence hurdle.
Neutral technical indicators warrant caution before placing fresh directional bets.

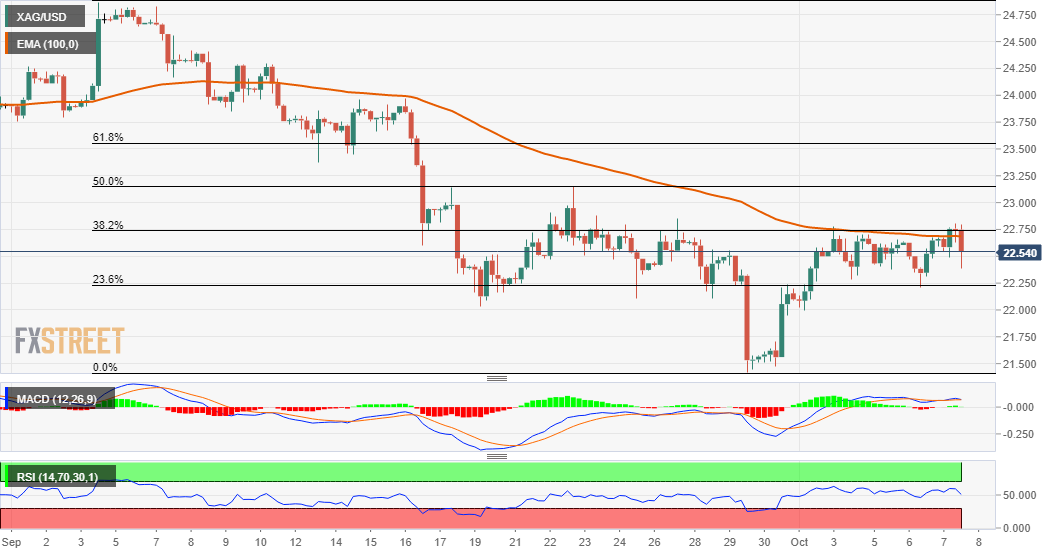
Silver struggled to capitalize on its modest intraday uptick to one-and-half-week tops and once again started retreating from the $22.80 resistance zone. The commodity refreshed daily lows during the early North American session and was last seen hovering around mid-$22.00s, down 0.40% for the day.

The mentioned barrier marks a confluence region comprising of the 38.2% Fibonacci level of the $24.87-$21.42 downfall and 100-period EMA on the 4-hour chart. This should now act as a key pivotal point for short-term traders and help determine the next leg of a directional move for the XAG/USD.

Meanwhile, technical indicators on the daily chart – though have recovered from the bearish territory – have been struggling to gain any meaningful traction. Moreover, neutral oscillators on hourly charts haven't been supportive of a firm intraday direction, warranting caution for aggressive traders.

From current levels, the 23.6% Fibo. level, around the $22.25 area, should protect the immediate downside. A convincing break below might turn the XAG/USD vulnerable to break below the $22.00 mark and slide further towards challenging last week's swing lows, around the $21.45-40 region.

On the flip side, momentum beyond the $22.80 confluence hurdle might struggle to find acceptance above the $23.00 mark and falter near the 50% Fibo. level resistance. some follow-through buying beyond the $23.10-15 region will be seen as a fresh trigger for bulls and set the stage for further gains. The XAG/USD might then accelerate the momentum towards the 61.8% Fibo. level, around the $23.55-60 region, before eventually aiming to reclaim the $24.00 round-figure mark.

Silver 4-hour chart

fxsoriginal

Technical levels to watch

XAG/USD

Overview
Today last price22.56
Today Daily Change-0.06
Today Daily Change %-0.27
Today daily open22.62
 
Trends
Daily SMA2022.81
Daily SMA5023.6
Daily SMA10025.1
Daily SMA20025.68
 
Levels
Previous Daily High22.68
Previous Daily Low22.21
Previous Weekly High22.85
Previous Weekly Low21.42
Previous Monthly High24.87
Previous Monthly Low21.42
Daily Fibonacci 38.2%22.39
Daily Fibonacci 61.8%22.5
Daily Pivot Point S122.32
Daily Pivot Point S222.03
Daily Pivot Point S321.85
Daily Pivot Point R122.79
Daily Pivot Point R222.97
Daily Pivot Point R323.26

Author

Haresh Menghani

Haresh Menghani is a detail-oriented professional with 10+ years of extensive experience in analysing the global financial markets.

More from Haresh Menghani
Share:

Markets move fast. We move first.

Orange Juice Newsletter brings you expert driven insights - not headlines. Every day on your inbox.

By subscribing you agree to our Terms and conditions.

Editor's Picks

EUR/USD clings to small gains near 1.1750

Following a short-lasting correction in the early European session, EUR/USD regains its traction and clings to moderate gains at around 1.1750 on Monday. Nevertheless, the pair's volatility remains low, with investors awaiting this weeks key US data releases and the ECB policy announcements.

GBP/USD edges higher toward 1.3400 as traders await key data and BoE

GBP/USD reverses its direction and advances toward 1.3400 following a drop to the 1.3350 area earlier in the day. The US Dollar struggles to gather recovery momentum as markets await Tuesday's Nonfarm Payrolls data, while the Pound Sterling holds steady ahead of the BoE policy announcements later in the week.

Gold builds on previous week's gains, approaches $4,350

Gold preserves its bullish momentum after rising more than 2% last week and climbs toward $4,350 on Monday. The precious metal extends its upside as the US Dollar remains on the back foot on growing expectations for a dovish Fed policy outlook next year.

Solana consolidates as spot ETF inflows near $1 billion signal institutional dip-buying

Solana price hovers above $131 at the time of writing on Monday, nearing the upper boundary of a falling wedge pattern, awaiting a decisive breakout. On the institutional side, demand for spot Solana Exchange-Traded Funds remained firm, pushing total assets under management to nearly $1 billion since launch. 

Big week ends with big doubts

The S&P 500 continued to push higher yesterday as the US 2-year yield wavered around the 3.50% mark following a Federal Reserve (Fed) rate cut earlier this week that was ultimately perceived as not that hawkish after all. The cut is especially boosting the non-tech pockets of the market.

Solana Price Forecast: SOL consolidates as spot ETF inflows near $1 billion signal institutional dip-buying

Solana (SOL) price hovers above $131 at the time of writing on Monday, nearing the upper boundary of a falling wedge pattern, awaiting a decisive breakout.