|

Silver Price Analysis: XAG/USD sticks to gains above one-month low, not out of the woods yet

  • Silver attracts some buying and recovers a part of the overnight slide to a one-month low.
  • The recent breakdown below important technical support levels favours bearish traders.
  • Any subsequent recovery might now be seen as a selling opportunity and remain capped.

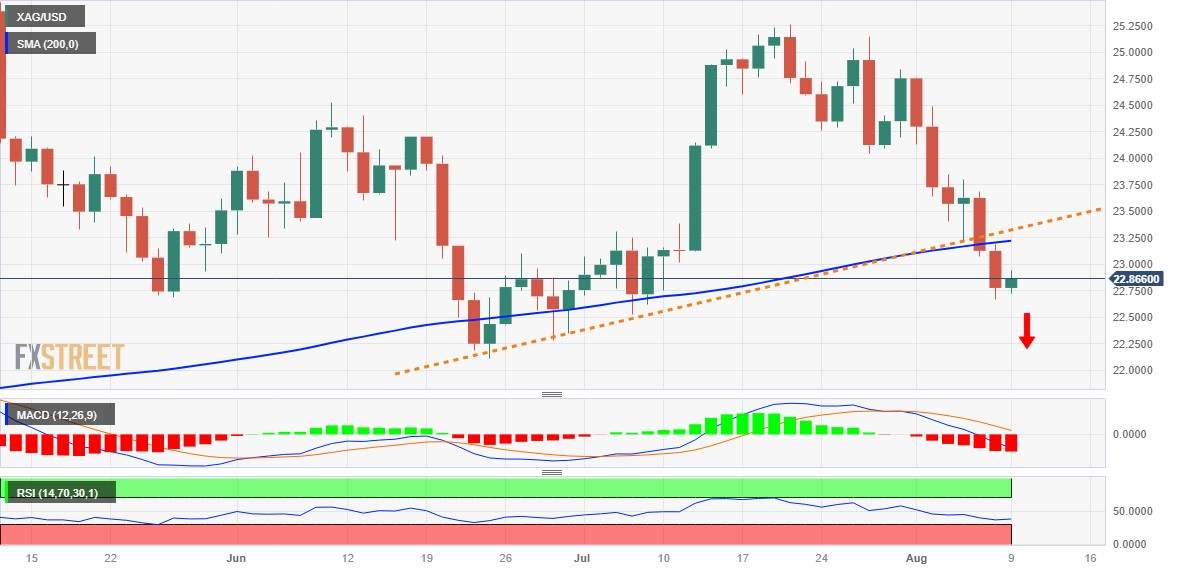
Silver gains some positive traction on Wednesday and for now, seems to have snapped a two-day losing streak to a one-month low, around the $22.65 region touched the previous day. The white metal maintains its bid tone around the $22.80-$22.85 zone through the early part of the European session, though the near-term technical setup suggests that the path of least resistance is to the downside.

Against the backdrop of this week's breakdown below an ascending trend-line extending from the June swing low, a subsequent slide and acceptance below the very important 200-day Simple Moving Average (SMA) was seen as a fresh trigger for bears. Moreover, oscillators on the daily chart are holding in the negative territory and are still far from being in the oversold zone. This, in turn, validates the near-term bearish outlook for the XAG/USD and supports prospects for the emergence of fresh selling at higher levels.

Hence, any further recovery beyond the $23.00 round-figure mark is likely to remain capped near the 200-day SMA breakpoint, currently pegged around the $23.25 region. The latter should act as a pivotal point, which if cleared decisively might trigger a short-covering move and lift the XAG/USD towards the $23.60-$23.65 horizontal barrier. The momentum could get extended further towards reclaiming the $24.00 mark.

On the flip side, the overnight swing low, around the $22.65 region might protect the immediate downside. The XAG/USD, however, still seems vulnerable to slide back towards retesting the multi-month low, around the $22.15-$22.10 area touched in June. Some follow-through selling below the $22.00 mark should pave the way for an extension of the recent downfall witnessed over the past three weeks or so, from the $25.25 area.

Silver daily chart

fxsoriginal

Technical levels to watch

XAG/USD

Overview
Today last price22.85
Today Daily Change0.07
Today Daily Change %0.31
Today daily open22.78
 
Trends
Daily SMA2024.33
Daily SMA5023.72
Daily SMA10024.06
Daily SMA20023.21
 
Levels
Previous Daily High23.19
Previous Daily Low22.67
Previous Weekly High24.84
Previous Weekly Low23.23
Previous Monthly High25.27
Previous Monthly Low22.52
Daily Fibonacci 38.2%22.87
Daily Fibonacci 61.8%22.99
Daily Pivot Point S122.57
Daily Pivot Point S222.36
Daily Pivot Point S322.04
Daily Pivot Point R123.09
Daily Pivot Point R223.4
Daily Pivot Point R323.61

Author

Haresh Menghani

Haresh Menghani is a detail-oriented professional with 10+ years of extensive experience in analysing the global financial markets.

More from Haresh Menghani
Share:

Markets move fast. We move first.

Orange Juice Newsletter brings you expert driven insights - not headlines. Every day on your inbox.

By subscribing you agree to our Terms and conditions.

Editor's Picks

EUR/USD clings to small gains near 1.1750

Following a short-lasting correction in the early European session, EUR/USD regains its traction and clings to moderate gains at around 1.1750 on Monday. Nevertheless, the pair's volatility remains low, with investors awaiting this weeks key data releases from the US and the ECB policy announcements.

GBP/USD edges higher toward 1.3400 ahead of US data and BoE

GBP/USD reverses its direction and advances toward 1.3400 following a drop to the 1.3350 area earlier in the day. The US Dollar struggles to gather recovery momentum as markets await Tuesday's Nonfarm Payrolls data, while the Pound Sterling holds steady ahead of the BoE policy announcements later in the week.

Gold pulls away from session high, holds above $4,300

Gold loses its bullish momentum and retreats below $4,350 after testing this level earlier on Monday. XAU/USD, however, stays in positive territory as the US Dollar remains on the back foot on growing expectations for a dovish Fed policy outlook next year.

Solana consolidates as spot ETF inflows near $1 billion signal institutional dip-buying

Solana price hovers above $131 at the time of writing on Monday, nearing the upper boundary of a falling wedge pattern, awaiting a decisive breakout. On the institutional side, demand for spot Solana Exchange-Traded Funds remained firm, pushing total assets under management to nearly $1 billion since launch. 

Big week ends with big doubts

The S&P 500 continued to push higher yesterday as the US 2-year yield wavered around the 3.50% mark following a Federal Reserve (Fed) rate cut earlier this week that was ultimately perceived as not that hawkish after all. The cut is especially boosting the non-tech pockets of the market.

Solana Price Forecast: SOL consolidates as spot ETF inflows near $1 billion signal institutional dip-buying

Solana (SOL) price hovers above $131 at the time of writing on Monday, nearing the upper boundary of a falling wedge pattern, awaiting a decisive breakout.