|

Silver Price Analysis: XAG/USD sticks to gains above $24.00, eyes multi-month top set in January

  • Silver scales higher for the third successive day and touches a fresh weekly high on Thursday.
  • The formation of a rectangle on the daily chart warrants caution before placing directional bets.
  • The technical setup, however, favours bulls and supports prospects for an eventual breakout.

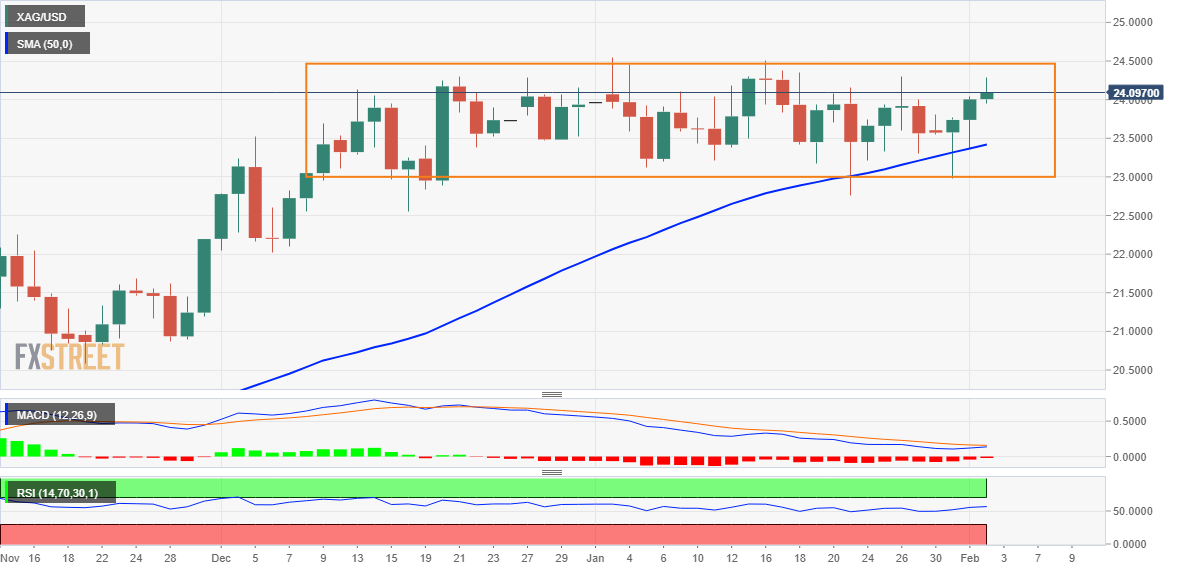
Silver builds on this week's move up from sub-$23.00 levels and gains some follow-through traction for the third successive day on Thursday. The white metal steadily climbs to $24.30 horizontal resistance during the early European session and moves well within the striking distance of the multi-month top touched in January.

Looking at the broader picture, the XAG/USD has been oscillating in a familiar trading range over the past one-and-half month or so. The price action, meanwhile, constitutes the formation of a rectangle pattern on the daily chart and points to indecision among traders. This, in turn, warrants caution for aggressive traders and before positioning for a firm near-term direction.

That said, positive technical indicators on the daily chart favour bulls and support prospects for an eventual breakout to the upside. A sustained strength beyond the trading range resistance, around the $24.50-$24.55 region, will reaffirm the constructive outlook. The XAG/USD might then aim to reclaim the $25.00 psychological mark for the first time since April 2022.

Some follow-through buying has the potential to lift the XAG/USD towards the next relevant hurdle near the $25.35 region en route to the $26.00 round figure.

On the flip side, the $24.00 mark now seems to protect the immediate downside. Any subsequent pullback might continue to attract some buyers near the $23.50-$23.45 region, below which the XAG/USD could slide to the $23.00 level. This is followed by support near the $22.75 region, which if broken decisively will expose the next relevant support near the $22.20-$22.15 zone.

Silver daily chart

fxsoriginal

Key levels to watch

XAG/USD

Overview
Today last price24.12
Today Daily Change0.12
Today Daily Change %0.50
Today daily open24
 
Trends
Daily SMA2023.75
Daily SMA5023.37
Daily SMA10021.62
Daily SMA20021.02
 
Levels
Previous Daily High24.04
Previous Daily Low23.37
Previous Weekly High24.3
Previous Weekly Low22.76
Previous Monthly High24.55
Previous Monthly Low22.76
Daily Fibonacci 38.2%23.78
Daily Fibonacci 61.8%23.62
Daily Pivot Point S123.57
Daily Pivot Point S223.13
Daily Pivot Point S322.89
Daily Pivot Point R124.24
Daily Pivot Point R224.48
Daily Pivot Point R324.91

Author

Haresh Menghani

Haresh Menghani is a detail-oriented professional with 10+ years of extensive experience in analysing the global financial markets.

More from Haresh Menghani
Share:

Editor's Picks

EUR/USD looks to regain the 200-day SMA

EUR/USD regains some balance and trade just above 1.1600 the figure ahead of the opening bell in Asia. The pair initially dipped to the 1.1530 zone for the first time since November, always following the stronger US Dollar and the marked flight-to-safety in the context of the ongoing Middle East crisis
 

GBP/USD slips below key averages as geopolitical risks mount

GBP/USD fell about 0.35% on Tuesday, settling around 1.3350 after slipping below the 200-day Exponential Moving Average for the first time since early December. The pair has pulled back sharply from its late-January high near 1.3870, shedding over 500 pips in a series of lower highs and lower lows. 

Gold bounces off lows, back above $5,100

Gold remains on the defensive, eroding part of the recent multi-day advance and managing to trade back above the $5,100 mark per troy ounce on Tuesday. The precious metal initially dropped just below the critical $5,000 threshold on the back of the persistent strength of the Greenback, higher US Treasury yields across the curve and investors' repricing of Fed rate cuts.

Ethereum: Whales step up buying as short positions contract

After holding firm heading into the last weekend, Ethereum whales have returned to action, pouncing on the volatility stemming from escalating military actions between the US and Iran.

Energy shock 2.0: Why rising Gas prices could hit the Euro

Even without a confirmed, sustained disruption, the mere risk to a key global energy chokepoint is enough to inject a significant premium into European Gas markets. And for the Euro, that matters.

Ripple falters amid sell-off jitters and negative funding rates

Ripple (XRP) has come under pressure, drifting lower to $1.35 at the time of writing on Tuesday. The over 2% correction looks poised to erase the previous day’s gains, which lifted the remittance token to $1.42.