|

Silver Price Analysis: XAG/USD snaps two-day uptrend below $25.00, focus on 200-SMA and US GDP

  • Silver Price retreats from fortnight-old resistance to print the first daily loss in three.
  • RSI pullback from overbought territory, looming bear cross on MACD tease XAG/USD sellers.
  • 200-SMA, three-week-old rising support line challenges Silver bears before putting them in the driver’s seat.
  • US GDP, Durable Goods Orders need to back recently hawkish Fed concerns to defend XAG/USD sellers.

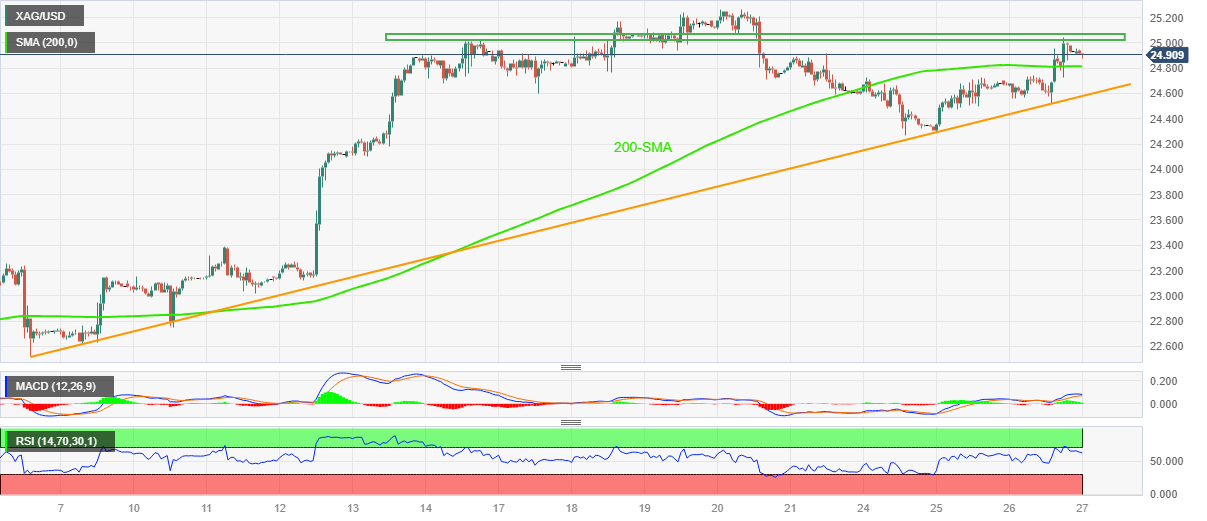
Silver Price (XAG/USD) sticks to mild losses around $24.90 amid early Thursday morning in Asia, after rising in the last two consecutive days to refresh the weekly top.

That said, the XAG/USD’s latest pullback could be linked to the metal’s inability to cross a two-week-old horizontal resistance area around $25.00-05 by the press time.

Also luring the Silver sellers is the looming bear cross on the MACD and the RSI (14) line’s retreat from the overbought territory.

However, the 200-SMA level of around $24.80 restricts further downside of the XAG/USD, a break of which will highlight an upward-sloping support line from early July, close to $24.55 at the latest, for the Silver sellers to watch.

In a case where the Silver Price remains bearish past $24.55, the weekly bottom of around $24.25 will act as the final defense of the Silver buyers.

Meanwhile, a clear upside break of the aforementioned horizontal resistance area surrounding $25.00-05 will need validation from the monthly peak close to $25.30 to welcome the XAG/USD bulls.

Following that, a run-up to challenge the yearly top of around $26.15 will be in the spotlight.

Overall, the market’s cautious mood ahead of the first readings of the US Gross Domestic Product (GDP) for the second quarter (Q2), US Durable Goods Orders for June and the monetary policy meeting of the European Central Bank (ECB) prod the Silver buyers of late.

Silver Price: Hourly chart

Trend: Further downside expected

Additional important levels

Overview
Today last price24.9
Today Daily Change-0.03
Today Daily Change %-0.12%
Today daily open24.93
 
Trends
Daily SMA2023.94
Daily SMA5023.63
Daily SMA10023.84
Daily SMA20023
 
Levels
Previous Daily High25.04
Previous Daily Low24.52
Previous Weekly High25.27
Previous Weekly Low24.59
Previous Monthly High24.53
Previous Monthly Low22.11
Daily Fibonacci 38.2%24.84
Daily Fibonacci 61.8%24.72
Daily Pivot Point S124.62
Daily Pivot Point S224.31
Daily Pivot Point S324.1
Daily Pivot Point R125.14
Daily Pivot Point R225.35
Daily Pivot Point R325.66

Author

Anil Panchal

Anil Panchal

FXStreet

Anil Panchal has nearly 15 years of experience in tracking financial markets. With a keen interest in macroeconomics, Anil aptly tracks global news/updates and stays well-informed about the global financial moves and their implications.

More from Anil Panchal
Share:

Markets move fast. We move first.

Orange Juice Newsletter brings you expert driven insights - not headlines. Every day on your inbox.

By subscribing you agree to our Terms and conditions.

Editor's Picks

EUR/USD clings to small gains near 1.1750

Following a short-lasting correction in the early European session, EUR/USD regains its traction and clings to moderate gains at around 1.1750 on Monday. Nevertheless, the pair's volatility remains low, with investors awaiting this weeks key data releases from the US and the ECB policy announcements.

GBP/USD edges higher toward 1.3400 ahead of US data and BoE

GBP/USD reverses its direction and advances toward 1.3400 following a drop to the 1.3350 area earlier in the day. The US Dollar struggles to gather recovery momentum as markets await Tuesday's Nonfarm Payrolls data, while the Pound Sterling holds steady ahead of the BoE policy announcements later in the week.

Gold pulls away from session high, holds above $4,300

Gold loses its bullish momentum and retreats below $4,350 after testing this level earlier on Monday. XAU/USD, however, stays in positive territory as the US Dollar remains on the back foot on growing expectations for a dovish Fed policy outlook next year.

Solana consolidates as spot ETF inflows near $1 billion signal institutional dip-buying

Solana price hovers above $131 at the time of writing on Monday, nearing the upper boundary of a falling wedge pattern, awaiting a decisive breakout. On the institutional side, demand for spot Solana Exchange-Traded Funds remained firm, pushing total assets under management to nearly $1 billion since launch. 

Big week ends with big doubts

The S&P 500 continued to push higher yesterday as the US 2-year yield wavered around the 3.50% mark following a Federal Reserve (Fed) rate cut earlier this week that was ultimately perceived as not that hawkish after all. The cut is especially boosting the non-tech pockets of the market.

Solana Price Forecast: SOL consolidates as spot ETF inflows near $1 billion signal institutional dip-buying

Solana (SOL) price hovers above $131 at the time of writing on Monday, nearing the upper boundary of a falling wedge pattern, awaiting a decisive breakout.