|

Silver Price Analysis: XAG/USD slumps below $23.50 ahead of the FOMC's decision

  • Silver fails to hold to its earlier gains above the 20-day EMA, with traders eyeing $23.00.
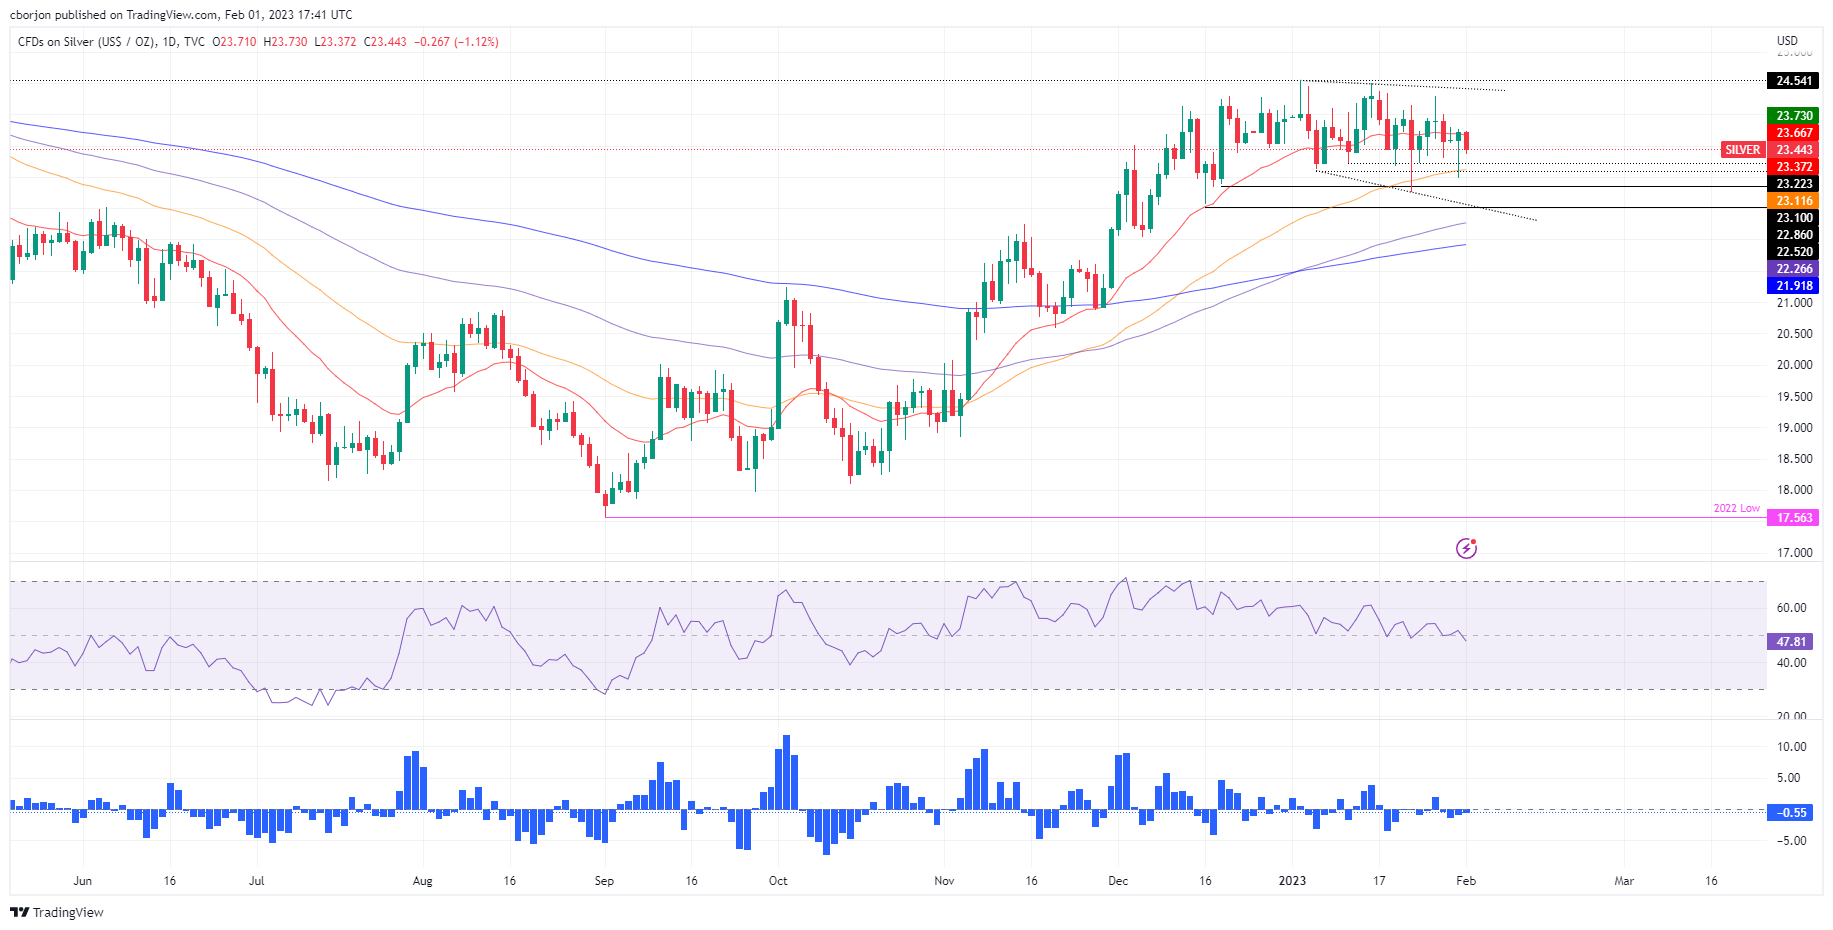
  • Silver Price Analysis: Consolidated, slightly skewed downwards, as oscillators turned bearish.

Silver price struggles at the 20-day Exponential Moving Average (EMA) at $23.66 and is dropping toward the lows of the day, at around $23.40s, as investors prepare for the US Federal Reserve’s (Fed) monetary policy decision. Therefore, XAG/USD traders are squaring their positions, awaiting Jerome Powell and his colleagues. At the time of writing, the XAG/USD exchanges hands at $23.44, below its opening price by 1.12%.

Silver Price Analysis: XAG/USD Technical Outlook

Silver remains pressured ahead of the FOMC’s decision, trapped within Tuesday’s price action, which witnessed a test of the 50-day Exponential Moving Average (EMA) at $23.11, though it was quickly rejected, achieving a daily close above the 20-day EMA. However, Wednesday’s story is different. The XAG/USD fell below Monday’s low of $23.54, eyeing to extend its losses toward the $23.00 figure.

Momentum indicators, like the Relative Strength Index (RSI), turned bearish, while the Rate of Change (RoC), suggests that sellers are gathering momentum.

Given the backdrop, the XAG/USD first support would be the $23.00 psychological level. A breach of the latter and the year-to-date (YTD) low at $22.76 is on the cards.

As an alternate scenario, the XAG/USD’s reclaiming the 20-day EMA will expose the $24.00 figure. Once cleared, Silver would test the YTD high at $24.54, followed by a rally to the $25.00 mark.

Silver Key Technical Levels

XAG/USD

Overview
Today last price23.44
Today Daily Change-0.30
Today Daily Change %-1.26
Today daily open23.74
 
Trends
Daily SMA2023.74
Daily SMA5023.32
Daily SMA10021.58
Daily SMA20021.01
 
Levels
Previous Daily High23.77
Previous Daily Low22.97
Previous Weekly High24.3
Previous Weekly Low22.76
Previous Monthly High24.55
Previous Monthly Low22.76
Daily Fibonacci 38.2%23.46
Daily Fibonacci 61.8%23.28
Daily Pivot Point S123.22
Daily Pivot Point S222.7
Daily Pivot Point S322.42
Daily Pivot Point R124.01
Daily Pivot Point R224.29
Daily Pivot Point R324.81

Author

Christian Borjon Valencia

Markets analyst, news editor, and trading instructor with over 14 years of experience across FX, commodities, US equity indices, and global macro markets.

More from Christian Borjon Valencia
Share:

Editor's Picks

EUR/USD rebounds from session lows, stays below 1.1650

EUR/USD is recovers modestly from session lows but remains in the red below 1.1650 in European trading on Thursday. The pair faces headwinds from a renewed uptick in the US Dollar amid a negative shift in risk sentiment. Surging energy prices due to the Middle East war keep the bearish pressure intact on the Euro. The US Jobless Claims data are next of note. 

GBP/USD stays weak near 1.3350 amid UK stagflation risks

GBP/USD sticks to losses near 1.3350 in the European session on Thursday. The Pound Sterling loses ground amid fears that the United Kingdom economy could face stagflation risks due to higher energy prices, while the US Dollar attracts fresh havem demand ahead of the US Jobless Claims data. 

Gold climbs near $5,200 as Iran war fuels safe-haven demand

Gold price extends its gains for the second successive session on Thursday as traders seek safety amid the ongoing war in the Middle East. US and Israeli strikes across Iranian territory and widespread Iranian missile and drone retaliation across the Middle East, including attacks on regional targets and military sites, prolong the crisis and its impact.

Three reasons to be bearish on Bitcoin

Bitcoin is holding up well taking into account the uncertainty stemming from the Middle East. Despite this week’s rally, the long-term outlook remains bearish. Here are three reasons why I think the storm for the largest cryptocurrency isn't over yet.

FX alert: When Energy still writes the macro script the Dollar holds the pen

The market is quietly sliding back into the trade nobody wanted to own, but everyone now has to respect again. The no quick off-ramp trade. Yesterday’s bounce in risk assets already looks less like a turning point and more like a classic relief rally in a market that briefly inhaled before realizing the room was still on fire.

Cardano Price Analysis: Approaches key trendline amid bearish sentiment

Cardano (ADA) price is approaching its descending trendline around $0.28 at the time of writing, set to shape the next directional move. The derivatives metrics paint a bearish picture, with ADA’s Open Interest continuing to fall and short bets rising among traders.