- Silver attracts some buyers and moves away from over a two-month low set on Thursday.
- The technical setup supports prospects for the emergence of fresh selling at higher levels.
- Strength beyond the 100-day SMA support breakpoint is needed to negate the negative bias.
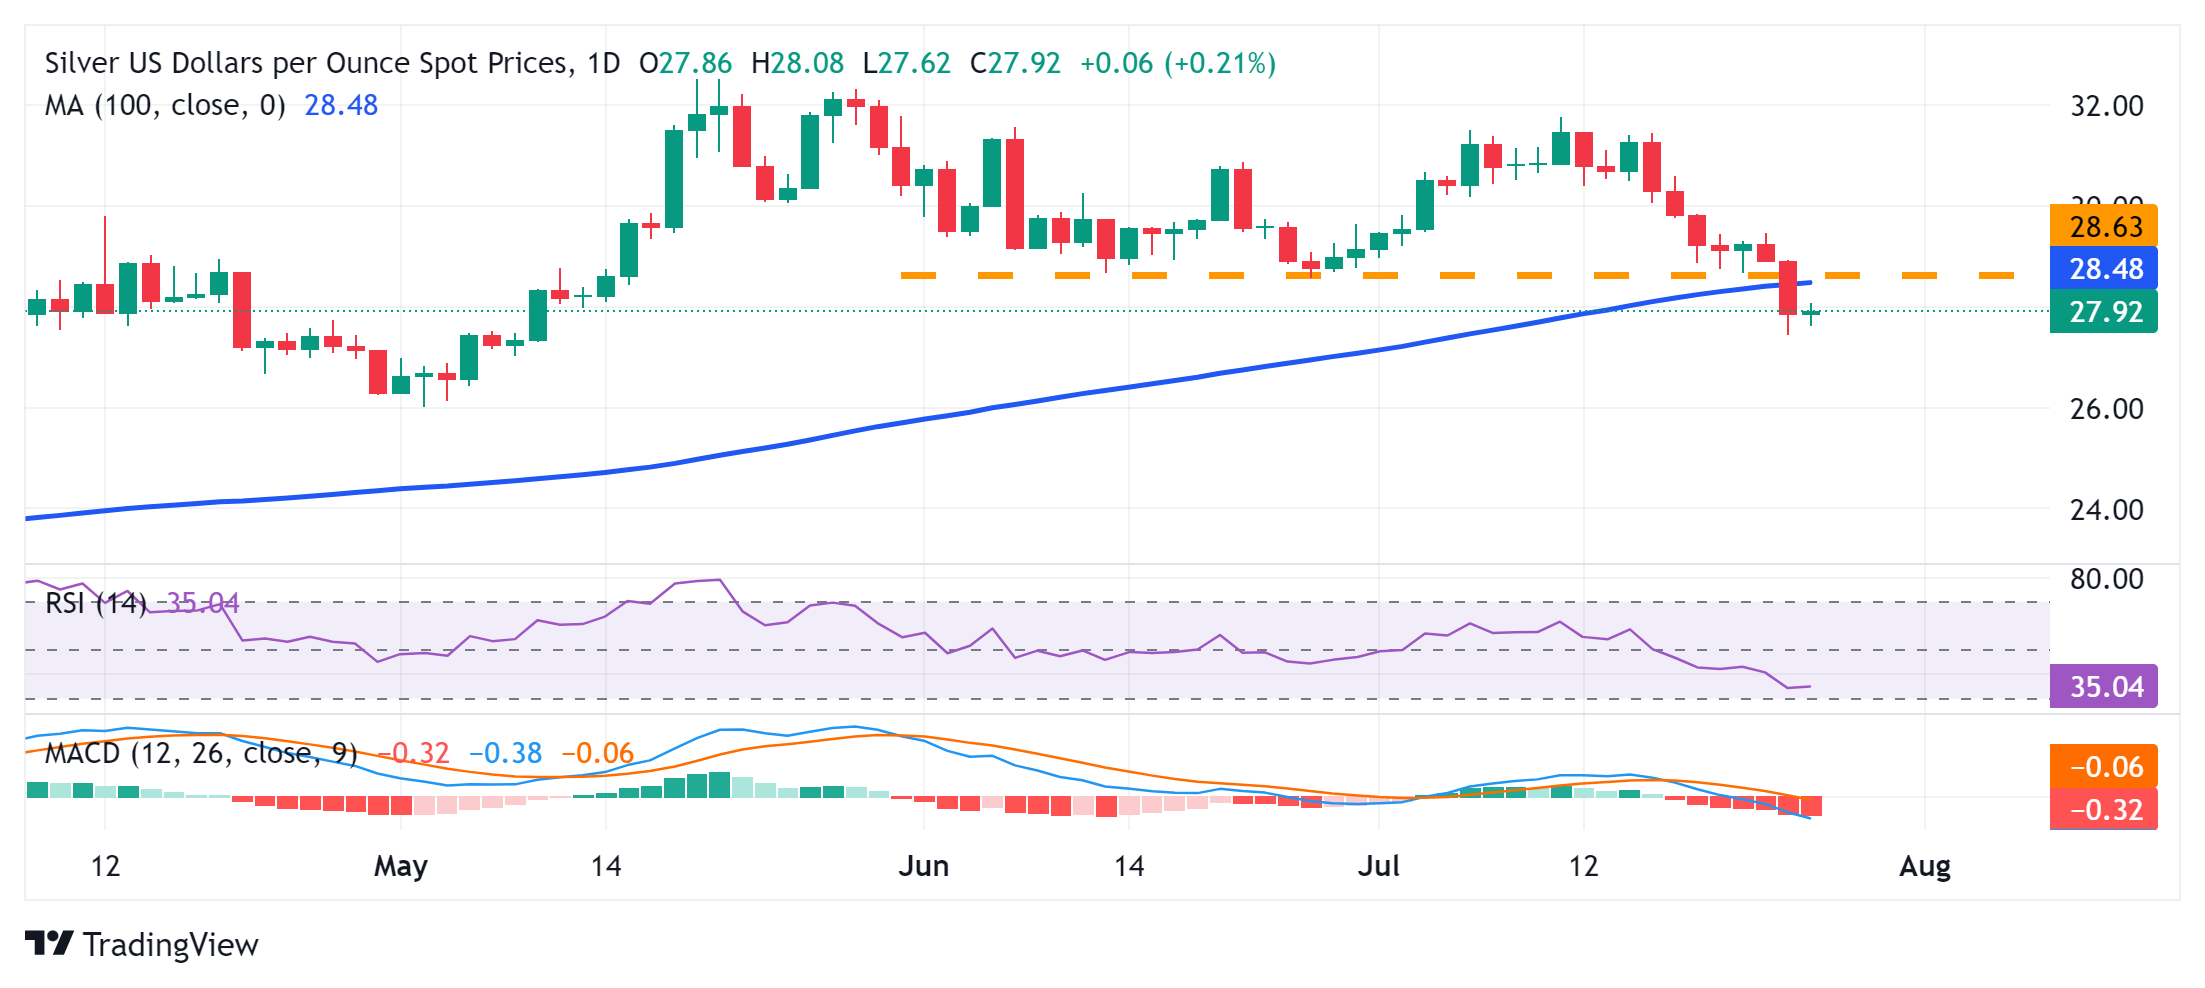
Silver (XAG/USD) edges higher during the Asian session on Friday and for now, seems to have snapped a two-day losing streak to its lowest level since May 9, around the $27.45 region touched the previous day. The white metal, however, struggles to build on the strength beyond the $28.00 mark and remains on track to register losses for the third successive week.
From a technical perspective, the overnight breakdown through the June swing low, around the $28.60-$28.55 region, which coincided with the 100-day Simple Moving Average (SMA), was seen as a fresh trigger for bearish traders. Moreover, oscillators on the daily chart have been gaining negative traction and are still away from being in the oversold territory, suggesting that the path of least resistance for the XAG/USD is to the downside.
Hence, any subsequent move up is more likely to attract fresh sellers and remain capped near the $28.55-$28.60 zone, or the 100-day SMA support breakpoint. The said area should now act as a key pivotal point, which if cleared decisively might trigger a short-covering rally. The XAG/USD might then surpass the $29.00 round-figure mark and accelerate the momentum towards the next relevant hurdle near the $29.40-$29.45 region, or the weekly peak.
Some follow-through buying should allow bulls to aim back to reclaim the $30.00 psychological mark. The upward trajectory could extend further towards the $30.35-$30.40 intermediate hurdle before the XAG/USD climbs to the $31.00 round-figure mark en route to the $31.40-$31.45 supply zone and the monthly peak, around the $31.75 region.
On the flip side, the Asian session low, around the $27.65-$27.60 area, could protect the immediate downside ahead of the $27.45 region, or the multi-month low touched on Thursday. A convincing break below the latter could make the XAG/USD vulnerable to accelerate the fall to the $27.00 mark, en route to the $26.60-$26.55 intermediate support, before eventually dropping to the 200-day SMA support, currently pegged near the $26.00 round figure.
Silver daily chart
Silver FAQs
Silver is a precious metal highly traded among investors. It has been historically used as a store of value and a medium of exchange. Although less popular than Gold, traders may turn to Silver to diversify their investment portfolio, for its intrinsic value or as a potential hedge during high-inflation periods. Investors can buy physical Silver, in coins or in bars, or trade it through vehicles such as Exchange Traded Funds, which track its price on international markets.
Silver prices can move due to a wide range of factors. Geopolitical instability or fears of a deep recession can make Silver price escalate due to its safe-haven status, although to a lesser extent than Gold's. As a yieldless asset, Silver tends to rise with lower interest rates. Its moves also depend on how the US Dollar (USD) behaves as the asset is priced in dollars (XAG/USD). A strong Dollar tends to keep the price of Silver at bay, whereas a weaker Dollar is likely to propel prices up. Other factors such as investment demand, mining supply – Silver is much more abundant than Gold – and recycling rates can also affect prices.
Silver is widely used in industry, particularly in sectors such as electronics or solar energy, as it has one of the highest electric conductivity of all metals – more than Copper and Gold. A surge in demand can increase prices, while a decline tends to lower them. Dynamics in the US, Chinese and Indian economies can also contribute to price swings: for the US and particularly China, their big industrial sectors use Silver in various processes; in India, consumers’ demand for the precious metal for jewellery also plays a key role in setting prices.
Silver prices tend to follow Gold's moves. When Gold prices rise, Silver typically follows suit, as their status as safe-haven assets is similar. The Gold/Silver ratio, which shows the number of ounces of Silver needed to equal the value of one ounce of Gold, may help to determine the relative valuation between both metals. Some investors may consider a high ratio as an indicator that Silver is undervalued, or Gold is overvalued. On the contrary, a low ratio might suggest that Gold is undervalued relative to Silver.
Information on these pages contains forward-looking statements that involve risks and uncertainties. Markets and instruments profiled on this page are for informational purposes only and should not in any way come across as a recommendation to buy or sell in these assets. You should do your own thorough research before making any investment decisions. FXStreet does not in any way guarantee that this information is free from mistakes, errors, or material misstatements. It also does not guarantee that this information is of a timely nature. Investing in Open Markets involves a great deal of risk, including the loss of all or a portion of your investment, as well as emotional distress. All risks, losses and costs associated with investing, including total loss of principal, are your responsibility. The views and opinions expressed in this article are those of the authors and do not necessarily reflect the official policy or position of FXStreet nor its advertisers. The author will not be held responsible for information that is found at the end of links posted on this page.
If not otherwise explicitly mentioned in the body of the article, at the time of writing, the author has no position in any stock mentioned in this article and no business relationship with any company mentioned. The author has not received compensation for writing this article, other than from FXStreet.
FXStreet and the author do not provide personalized recommendations. The author makes no representations as to the accuracy, completeness, or suitability of this information. FXStreet and the author will not be liable for any errors, omissions or any losses, injuries or damages arising from this information and its display or use. Errors and omissions excepted.
The author and FXStreet are not registered investment advisors and nothing in this article is intended to be investment advice.
Recommended content
Editors’ Picks

EUR/USD stabilizes around 1.2550 after hitting two-year lows
EUR/USD plunged to 1.0223, its lowest in over two years, as risk aversion fueled demand for the US Dollar. Thin post-holiday trading exacerbated the movements, with financial markets slowly returning to normal.

USD/JPY flirts with multi-month highs in the 158.00 region
The USD/JPY pair traded as high as 157.84 on Thursday, nearing the December multi-month high of 158.07. Additional gains are on the docket amid prevalent risk aversion.
Gold retains the $2,650 level as Asian traders reach their desks
Gold gathered recovery momentum and hit a two-week-high at $2,660 in the American session on Thursday. The precious metal benefits from the sour market mood and looks poised to extend its advance ahead of the weekly close.

These 5 altcoins are rallying ahead of $16 billion FTX creditor payout
FTX begins creditor payouts on January 3, in agreement with BitGo and Kraken, per an official announcement. Bonk, Fantom, Jupiter, Raydium and Solana are rallying on Thursday, before FTX repayment begins.

Three Fundamentals: Year-end flows, Jobless Claims and ISM Manufacturing PMI stand out Premium
Money managers may adjust their portfolios ahead of the year-end. Weekly US Jobless Claims serve as the first meaningful release in 2025. The ISM Manufacturing PMI provides an initial indication ahead of Nonfarm Payrolls.

Best Forex Brokers with Low Spreads
VERIFIED Low spreads are crucial for reducing trading costs. Explore top Forex brokers offering competitive spreads and high leverage. Compare options for EUR/USD, GBP/USD, USD/JPY, and Gold.