Silver Price Analysis: XAG/USD seems vulnerable to slide further, break below mid-$22.00s awaited


  • Silver remains under some selling for the second straight day and drops closer to the weekly trough.
  • The technical setup favours bearish traders and supports prospects for additional near-term losses.
  • A sustained strength beyond the $23.60-$23.70 supply zone is needed to negate the negative bias.

Silver (XAG/USD) drifts lower for the second successive day on Friday – also marking the third day of a negative move in the previous four – and drops to the lower end of its weekly range during the early part of the European session. The white metal currently trades around the $22.65-$22.60 region, down over 0.50% for the day, and seems vulnerable to weaken further.

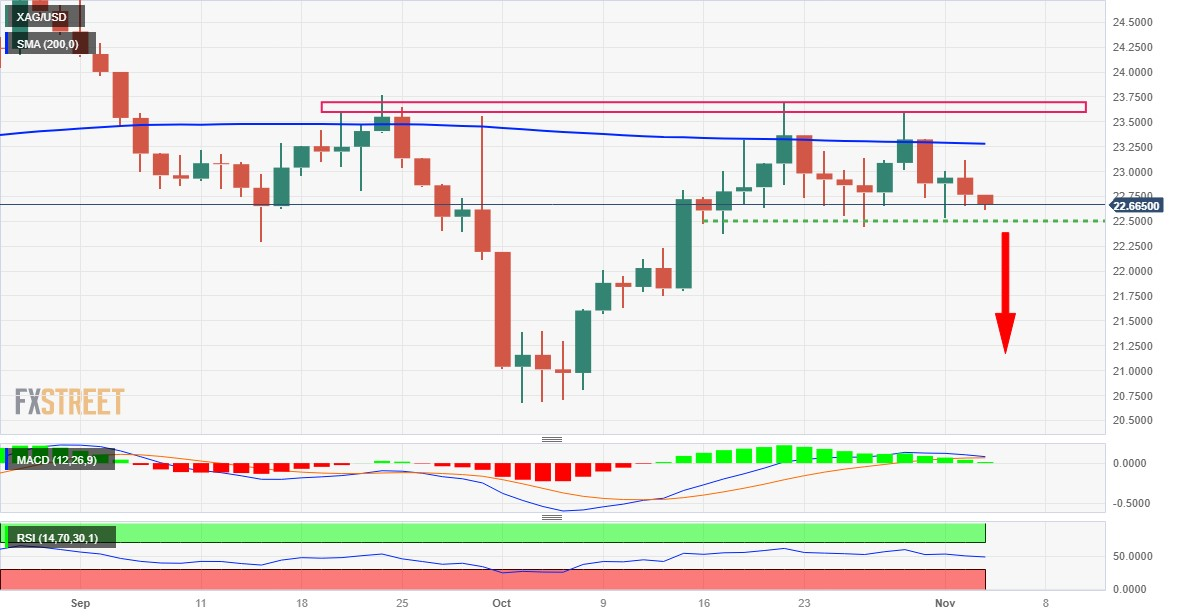
The recent repeated failures to find acceptance above the 200-day Simple Moving Average (SMA) and rejections near the $23.60-$23.70 supply zone constitute the formation of a multiple tops pattern. Furthermore, technical indicators on the daily chart have again started gaining negative traction and validate the near-term bearish outlook for the XAG/USD. That said, it will still be prudent to wait for some follow-through selling below the $22.50 support zone before positioning for further losses.

The XAG/USD might then accelerate the fall to the $22.00 mark before dropping to the $21.70 horizontal support zone en route to the $21.35-$21.30 region. The downward trajectory could get extended further and drag the white metal below the $21.00 mark, towards the $20.70-$20.65 area, or a seven-month low touched in October.

On the flip side, the $23.00 round figure now seems to cap the immediate upside ahead of the $23.10-$23.15 horizontal barrier. This is closely followed by the 200-day SMA, currently around the $23.25 region, above which the XAG/USD could challenge the $23.60-$23.70 supply zone. The latter should act as a key pivotal point, which if cleared decisively will negate the negative outlook and shift the near-term bias in favour of bullish traders, paving the way for a move towards the $24.00 mark.

Some follow-through buying has the potential to lift the XAG/USD beyond the $24.20-$24.25 intermediate resistance and allow bulls to make a fresh attempt to conquer the $25.00 psychological mark.

Silver daily chart

fxsoriginal

Technical levels to watch

XAG/USD

Overview
Today last price 22.63
Today Daily Change -0.14
Today Daily Change % -0.61
Today daily open 22.77
 
Trends
Daily SMA20 22.66
Daily SMA50 22.9
Daily SMA100 23.21
Daily SMA200 23.28
 
Levels
Previous Daily High 23.12
Previous Daily Low 22.66
Previous Weekly High 23.36
Previous Weekly Low 22.44
Previous Monthly High 23.7
Previous Monthly Low 20.68
Daily Fibonacci 38.2% 22.84
Daily Fibonacci 61.8% 22.95
Daily Pivot Point S1 22.57
Daily Pivot Point S2 22.38
Daily Pivot Point S3 22.1
Daily Pivot Point R1 23.04
Daily Pivot Point R2 23.32
Daily Pivot Point R3 23.51


Share: Feed news

Information on these pages contains forward-looking statements that involve risks and uncertainties. Markets and instruments profiled on this page are for informational purposes only and should not in any way come across as a recommendation to buy or sell in these assets. You should do your own thorough research before making any investment decisions. FXStreet does not in any way guarantee that this information is free from mistakes, errors, or material misstatements. It also does not guarantee that this information is of a timely nature. Investing in Open Markets involves a great deal of risk, including the loss of all or a portion of your investment, as well as emotional distress. All risks, losses and costs associated with investing, including total loss of principal, are your responsibility. The views and opinions expressed in this article are those of the authors and do not necessarily reflect the official policy or position of FXStreet nor its advertisers. The author will not be held responsible for information that is found at the end of links posted on this page.

If not otherwise explicitly mentioned in the body of the article, at the time of writing, the author has no position in any stock mentioned in this article and no business relationship with any company mentioned. The author has not received compensation for writing this article, other than from FXStreet.

FXStreet and the author do not provide personalized recommendations. The author makes no representations as to the accuracy, completeness, or suitability of this information. FXStreet and the author will not be liable for any errors, omissions or any losses, injuries or damages arising from this information and its display or use. Errors and omissions excepted.

The author and FXStreet are not registered investment advisors and nothing in this article is intended to be investment advice.

Recommended content


Recommended content

Editors’ Picks

EUR/USD retreats to 1.0700 area following post-PCE jump

EUR/USD retreats to 1.0700 area following post-PCE jump

After spiking to a daily high of 1.0720 with the immediate reaction to US PCE inflation data, EUR/USD lost its traction and declined to the 1.0700 area. Investors remain cautious ahead of this weekend's French election and make it difficult for the Euro to gather strength.

EUR/USD News

GBP/USD stays below 1.2650 after US inflation data

GBP/USD stays below 1.2650 after US inflation data

GBP/USD struggles to preserve its bullish momentum and trades below 1.2650 in the American session on Friday. Earlier in the day, the data from the US showed that the annual core PCE inflation declined to 2.6% in May, limiting the USD's upside and helping the pair hold its ground.

GBP/USD News

Gold keeps its daily gains near $2,330 following US PCE data

Gold keeps its daily gains near $2,330 following US PCE data

Gold prices maintain their constructive bias around $2,330 after US inflation readings gauged by the PCE matched consensus in May and US yields advance slightly across the curve.

Gold News

BTC struggles around the $62,000 level

BTC struggles around the $62,000 level

Bitcoin price faces pullback resistance at the lower band of the descending wedge around $62,000. Ethereum price finds support at $3,288, the 61.8% Fibonacci retracement level. Ripple price faces resistance at $0.500, its daily resistance level.

Read more

French Elections Preview: Euro to suffer after the calm, as specter of extremists, uncertainty rise Premium

French Elections Preview: Euro to suffer after the calm, as specter of extremists, uncertainty rise

The first round of French parliamentary elections is set to trigger high uncertainty. Soothing messages from the far right and far left leave the Euro vulnerable to falls. Calm may return only after the second round of voting on  July 7.

Read more

Forex MAJORS

Cryptocurrencies

Signatures