Silver Price Analysis: XAG/USD recovery falters despite falling bond yields, sellers in charge


  • XAG/USD sees resistance, trading at $23.82, down 0.36% amidst weakened US Treasury yields.
  • Despite the downward tilt, breaking June 9 daily high could shift Silver’s bias to neutral upwards.
  • Oscillators predict near-term downside, indicating sellers’ continued market control.

Silver price erases some of its earlier losses which witnesses XAG/USD’s printing a two-week low at $23.22 before reversing its direction. However, XAG/USD’s recovery stalled at a resistance area, with several technical indicators capping the uptrend. At the time of writing, the XAG/USD is trading at $23.82, down 0.36%.

XAG/USD Price Analysis: Technical outlook

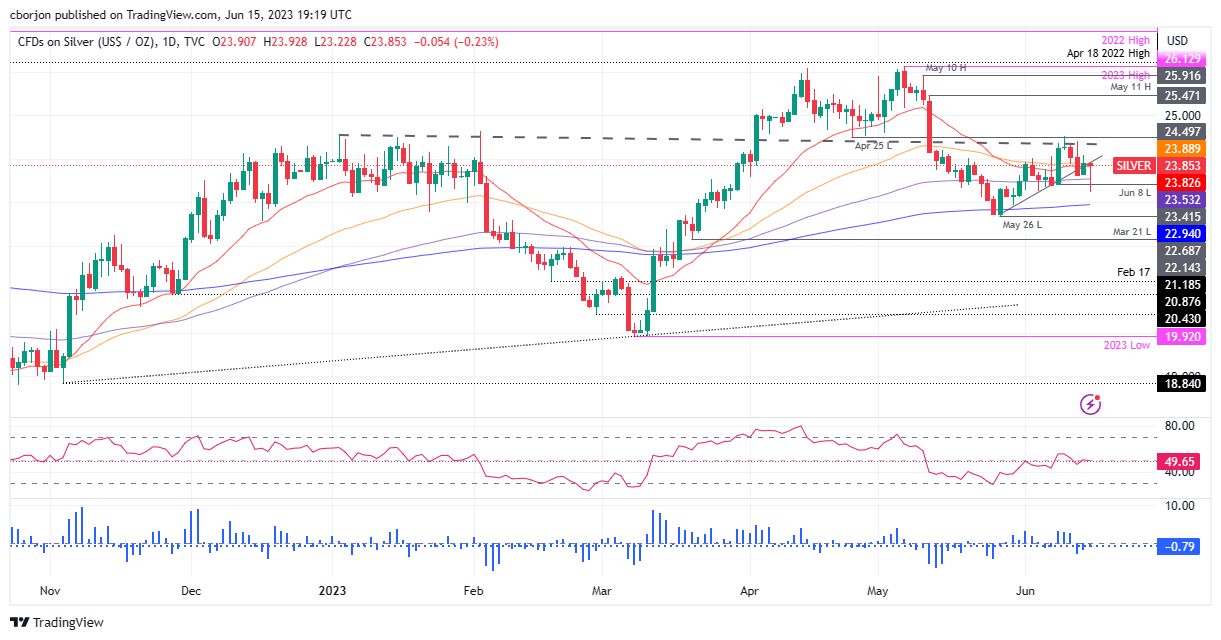
The XAG/USD remains neutrally biased, tilted downwards as the white metal can’t reclaim the April 25 swing low of $24.49, an inflection point that can pave the way for further upside. Should be said Silver failed to rally, despite a drop in US Treasury bond yields. Therefore, XAG/USD’s momentum in the short term could be fading, warranting a bearish resumption.

To the downside, XAG/USD would find first support at the 100-day Exponential Moving Average (EMA) at $23.53, which, once cleared, would put at risk $23.00. Break below, and the 200-day EMA will be up for grabs at $22.94 before challenging May 26 low at $22.68, with further downside expected past the latter.

Conversely, the XAG/USD must crack the June 9 daily high for a bullish resumption at $24.52. The break above will put into play a higher trading range and shift Silver’s bias to neutral upwards. The next resistance would be $25.00, followed by May 11 high at $25.47.

However, oscillators suggest further downside expected in the near term, with the Relative Strength Index (RSI) at a bearish area and the three-day Rate of Change (RoC), portraying sellers remaining in control.

XAG/USD Price Action – Daily chart

XAG/USD Daily chart

XAG/USD

Overview
Today last price 23.86
Today Daily Change -0.07
Today Daily Change % -0.29
Today daily open 23.93
 
Trends
Daily SMA20 23.59
Daily SMA50 24.47
Daily SMA100 23.36
Daily SMA200 22.35
 
Levels
Previous Daily High 24.08
Previous Daily Low 23.66
Previous Weekly High 24.53
Previous Weekly Low 23.25
Previous Monthly High 26.14
Previous Monthly Low 22.68
Daily Fibonacci 38.2% 23.92
Daily Fibonacci 61.8% 23.82
Daily Pivot Point S1 23.7
Daily Pivot Point S2 23.46
Daily Pivot Point S3 23.27
Daily Pivot Point R1 24.12
Daily Pivot Point R2 24.32
Daily Pivot Point R3 24.55


Share: Feed news

Information on these pages contains forward-looking statements that involve risks and uncertainties. Markets and instruments profiled on this page are for informational purposes only and should not in any way come across as a recommendation to buy or sell in these assets. You should do your own thorough research before making any investment decisions. FXStreet does not in any way guarantee that this information is free from mistakes, errors, or material misstatements. It also does not guarantee that this information is of a timely nature. Investing in Open Markets involves a great deal of risk, including the loss of all or a portion of your investment, as well as emotional distress. All risks, losses and costs associated with investing, including total loss of principal, are your responsibility. The views and opinions expressed in this article are those of the authors and do not necessarily reflect the official policy or position of FXStreet nor its advertisers. The author will not be held responsible for information that is found at the end of links posted on this page.

If not otherwise explicitly mentioned in the body of the article, at the time of writing, the author has no position in any stock mentioned in this article and no business relationship with any company mentioned. The author has not received compensation for writing this article, other than from FXStreet.

FXStreet and the author do not provide personalized recommendations. The author makes no representations as to the accuracy, completeness, or suitability of this information. FXStreet and the author will not be liable for any errors, omissions or any losses, injuries or damages arising from this information and its display or use. Errors and omissions excepted.

The author and FXStreet are not registered investment advisors and nothing in this article is intended to be investment advice.

Recommended content


Recommended content

Editors’ Picks

AUD/USD: Extra consolidation appears on the cards

AUD/USD: Extra consolidation appears on the cards

AUD/USD set aside a two-day recovery past the 0.6300 hurdle and came under pressure on Wednesday, always in response to US tariff fears and the marked bounce in the Greenback.

AUD/USD News
EUR/USD: Further downside could retest the 200-day SMA

EUR/USD: Further downside could retest the 200-day SMA

EUR/USD accelerated its losses and retested lows near the 1.0740 zone on the back of the stronger US Dollar and persistent jitters surrounding potential tariffs on EU imports as soon as next week.

EUR/USD News
Gold remains slightly offered just above $3,000

Gold remains slightly offered just above $3,000

Gold is trading in a narrow range on Wednesday but continues to hold firm just above the $3,000 mark. The precious metal is drawing support from upbeat sentiment in the broader commodities space, buoyed by Copper’s surge to a fresh all-time high earlier in the day.

Gold News
Crypto Today: SHIB, DOGE and PEPE enter $6B gains as BTC aims at $90k

Crypto Today: SHIB, DOGE and PEPE enter $6B gains as BTC aims at $90k

Cryptocurrency market capitalization dips 1.3% to hit $2.9 trillion on Tuesday, with market indicators showing capital rotation toward memecoins.

Read more
Sticky UK services inflation shows signs of tax hike impact

Sticky UK services inflation shows signs of tax hike impact

There are tentative signs that the forthcoming rise in employer National Insurance is having an impact on service sector inflation, which came in a tad higher than expected in February. It should still fall back in the second quarter, though, keeping the Bank of England on track for three further rate cuts this year.

Read more
The Best brokers to trade EUR/USD

The Best brokers to trade EUR/USD

SPONSORED Discover the top brokers for trading EUR/USD in 2025. Our list features brokers with competitive spreads, fast execution, and powerful platforms. Whether you're a beginner or an expert, find the right partner to navigate the dynamic Forex market.

Read More

Forex MAJORS

Cryptocurrencies

Signatures

Best Brokers of 2025