|

Silver Price Analysis: XAG/USD pulls back as dark cloud cover loom

  • Silver retreats to $28.09, unable to hold above the crucial $29 mark, indicating potential further declines.
  • The 'dark cloud cover' technical pattern suggests vulnerability and possible downward movement.
  • Focus remains on silver's ability to sustain above the $28.00 threshold, with key support and resistance levels closely watched.

Silver prices retreat from daily highs reached $29.01, dropping 2.63%, affected by high US Treasury yields, and stirring resistance around the $29.00 threshold. The XAG/USD trades at $28.09, breaking key support levels on its way toward current spot prices.

XAG/USD Price Analysis: Technical outlook

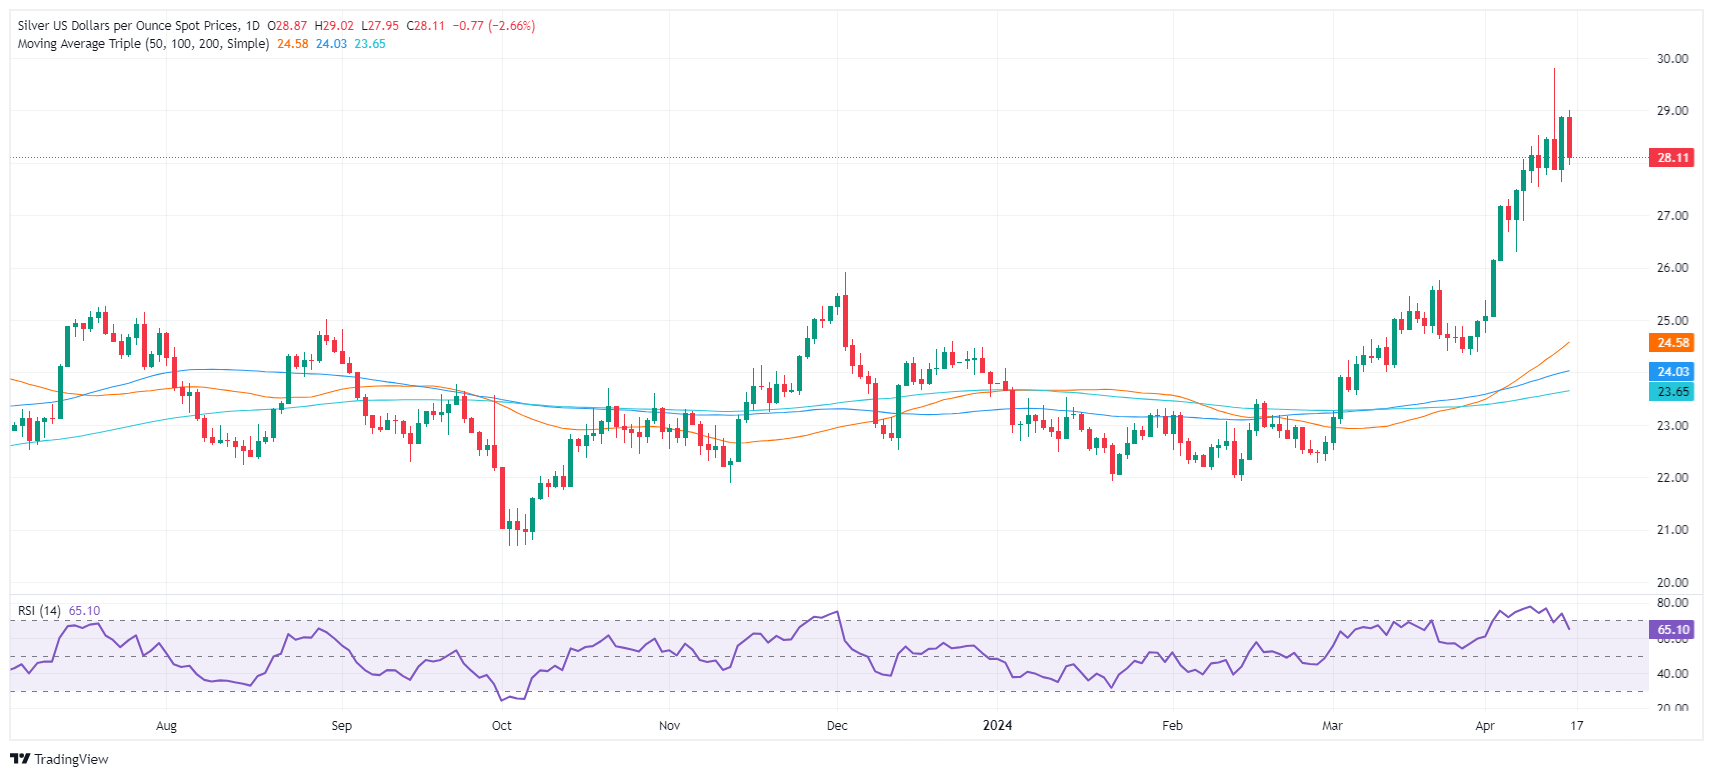
From a technical standpoint, XAG/USD buyers failed to hold Siver’s quote above the psychological $29.00 level after reaching a year-to-date (YTD) high of $29.79. That exacerbated the grey’s metal drop toward the $28.00 mark, opening the door for further downside. During the last couple of days, price action formed a ‘dark cloud cover’ that needs confirmation below the April 15 low of $27.59.

Momentum was extremely bullish, though the Relative Strength Index (RSI) exited from overbought conditions during the day, sponsoring a leg-down on Silver. That said, XAG/USD could witness a pullback before buyers attempt to challenge the $29.00 mark.

Given the backdrop, Siver’s first support would be $27.59, followed by the $27.00 mark. Further losses are seen at $26.29, the April 5 low. On the flip side, if buyers keep the XAG/USD spot price above $28.00, the next resistance levels are seen at the June 10, 2021, high at $28.28, followed by the May 18, 2021 high at $28.74.

XAG/USD Price Action – Daily Chart

XAG/USD

Overview
Today last price28.1
Today Daily Change-0.77
Today Daily Change %-2.67
Today daily open28.87
 
Trends
Daily SMA2026.28
Daily SMA5024.46
Daily SMA10024
Daily SMA20023.63
 
Levels
Previous Daily High28.89
Previous Daily Low27.62
Previous Weekly High29.8
Previous Weekly Low26.88
Previous Monthly High25.77
Previous Monthly Low22.51
Daily Fibonacci 38.2%28.41
Daily Fibonacci 61.8%28.11
Daily Pivot Point S128.03
Daily Pivot Point S227.19
Daily Pivot Point S326.77
Daily Pivot Point R129.3
Daily Pivot Point R229.73
Daily Pivot Point R330.57

Author

Christian Borjon Valencia

Markets analyst, news editor, and trading instructor with over 14 years of experience across FX, commodities, US equity indices, and global macro markets.

More from Christian Borjon Valencia
Share:

Editor's Picks

EUR/USD weakens to near 1.1900 as traders eye US data

EUR/USD eases to near 1.1900 in Tuesday's European trading hours, snapping the two-day winning streak. Markets turn cautious, lifting the haven demand for the US Dollar ahead of the release of key US economic data, including Retail Sales and ADP Employment Change 4-week average.

GBP/USD stays in the red below 1.3700 on renewed USD demand

GBP/USD trades on a weaker note below 1.3700 in the European session on Tuesday. The pair faces challenges due to renewed US Dollar demand, UK political risks and rising expectations of a March Bank of England rate cut. The immediate focus is now on the US Retail Sales data. 

Gold sticks to modest losses above $5,000 ahead of US data

Gold sticks to modest intraday losses through the first half of the European session, though it holds comfortably above the $5,000 psychological mark and the daily swing low. The outcome of Japan's snap election on Sunday removes political uncertainty, which along with signs of easing tensions in the Middle East, remains supportive of the upbeat market mood. This turns out to be a key factor exerting downward pressure on the safe-haven precious metal.

Bitcoin Cash trades lower, risks dead-cat bounce amid bearish signals

Bitcoin Cash trades in the red below $522 at the time of writing on Tuesday, after multiple rejections at key resistance. BCH’s derivatives and on-chain indicators point to growing bearish sentiment and raise the risk of a dead-cat bounce toward lower support levels.

Follow the money, what USD/JPY in Tokyo is really telling you

Over the past two Tokyo sessions, this has not been a rate story. Not even close. Interest rate differentials have been spectators, not drivers. What has moved USD/JPY in local hours has been flow and flow alone.

Bitcoin Cash trades lower, risks dead-cat bounce amid bearish signals

Bitcoin Cash (BCH) trades in the red below $522 at the time of writing on Tuesday, after multiple rejections at key resistance. BCH’s derivatives and on-chain indicators point to growing bearish sentiment and raise the risk of a dead-cat bounce toward lower support levels.