- Silver extends its recent pullback from the YTD top, though the downside seems limited.
- The setup favours support prospects for the emergence of dip-buying near mid-$24.00s.
- Weakness below the latter might prompt fresh selling and pave the way for deeper losses.
Silver (XAG/USD) remains under some selling pressure for the second successive day on Tuesday and retreats further from the YTD peak, around the $25.45 region touched last week. The white metal continues losing ground through the first half of the European session and drops to a fresh daily low, around the $24.85-$24.80 area in the last hour.
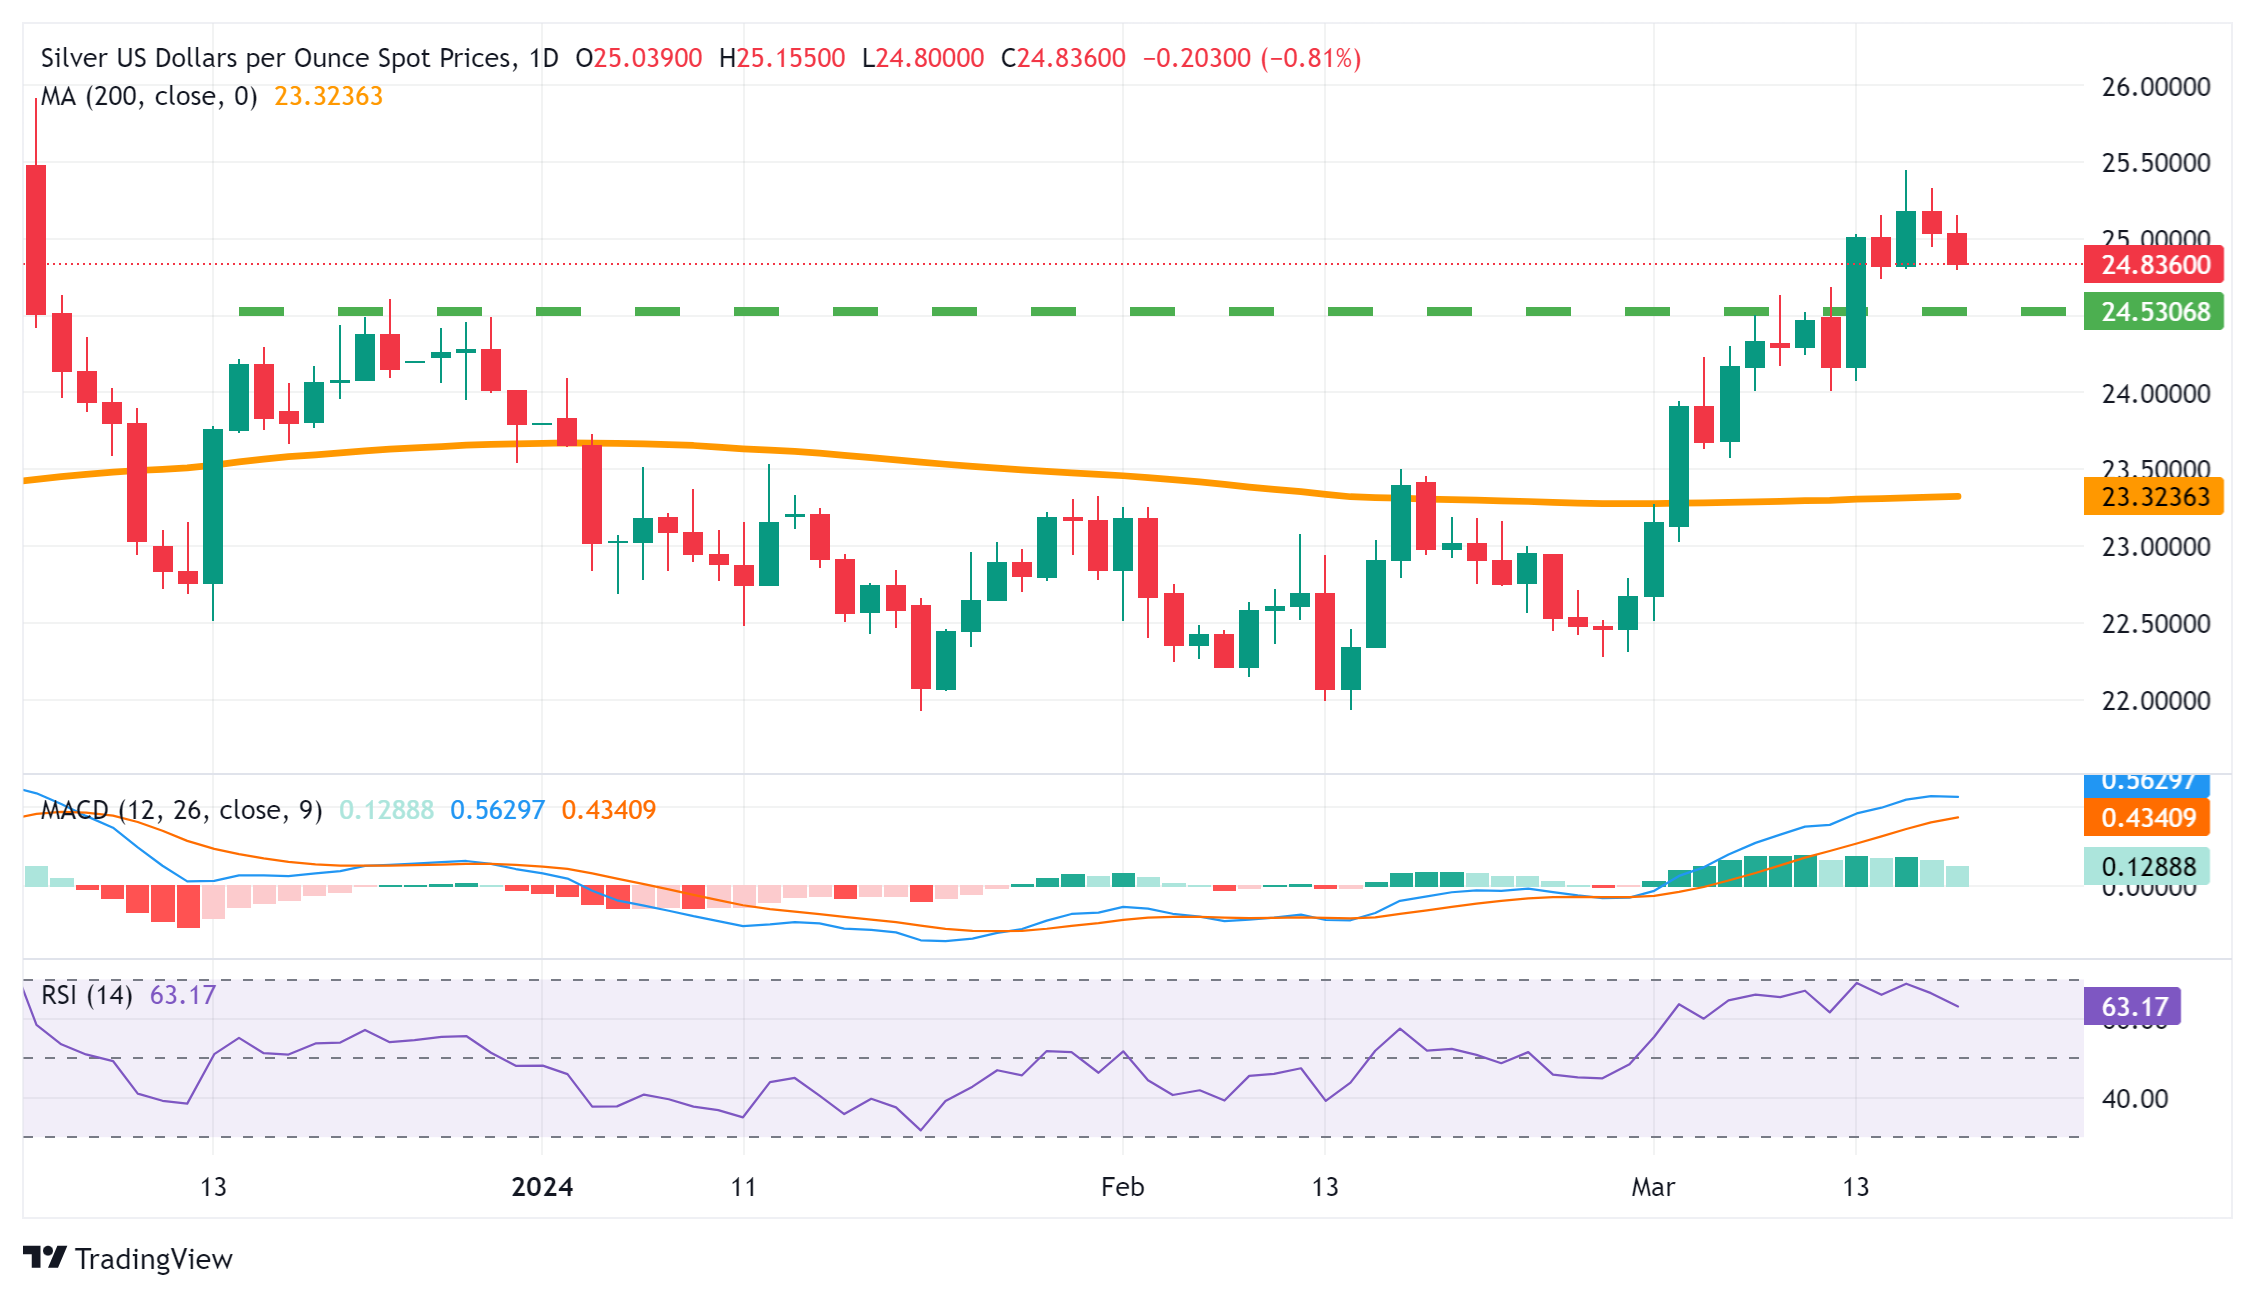
From a technical perspective, the recent breakout through the very important 200-day Simple Moving (SMA) and a subsequent strength beyond the $24.50-$24.60 horizontal barrier favour bullish traders. Moreover, oscillators on the daily chart – though have been retreating from higher levels – are still holding comfortably in the positive territory. This, in turn, supports prospects for the emergence of some dip-buying and warrants some caution before positioning for any further depreciating move.
Meanwhile, the $24.60-$24.50 resistance breakpoint now seems to protect the immediate downside. Any further decline could be seen as a buying opportunity and is more likely to remain limited near the $24.15-$24.10 region. This is followed by the $24.00 round-figure mark, which if broken decisively might shift the bias in favour of bearish traders. The XAG/USD might then accelerate the corrective decline back towards the 200-day SMA support, currently pegged near the $23.35-$23.30 region.
On the flip side, momentum back above the $25.00 psychological mark might confront some resistance near the $25.20 region ahead of the YTD peak, around the $25.45 area. Some follow-through buying will reaffirm the near-term positive outlook and allow the XAG/USD to aim back to challenge the December 2023 swing high – levels just ahead of the $26.00 round figure. The latter should act as a pivotal point, which if cleared will pave the way for an extension of over a two-week-old uptrend.
Silver daily chart
Information on these pages contains forward-looking statements that involve risks and uncertainties. Markets and instruments profiled on this page are for informational purposes only and should not in any way come across as a recommendation to buy or sell in these assets. You should do your own thorough research before making any investment decisions. FXStreet does not in any way guarantee that this information is free from mistakes, errors, or material misstatements. It also does not guarantee that this information is of a timely nature. Investing in Open Markets involves a great deal of risk, including the loss of all or a portion of your investment, as well as emotional distress. All risks, losses and costs associated with investing, including total loss of principal, are your responsibility. The views and opinions expressed in this article are those of the authors and do not necessarily reflect the official policy or position of FXStreet nor its advertisers. The author will not be held responsible for information that is found at the end of links posted on this page.
If not otherwise explicitly mentioned in the body of the article, at the time of writing, the author has no position in any stock mentioned in this article and no business relationship with any company mentioned. The author has not received compensation for writing this article, other than from FXStreet.
FXStreet and the author do not provide personalized recommendations. The author makes no representations as to the accuracy, completeness, or suitability of this information. FXStreet and the author will not be liable for any errors, omissions or any losses, injuries or damages arising from this information and its display or use. Errors and omissions excepted.
The author and FXStreet are not registered investment advisors and nothing in this article is intended to be investment advice.
Recommended content
Editors’ Picks

Gold price conquers $3,100 for the first time ever on tariff war fears
The record rally in Gold price remains unabated as buyers conquer the $3,100 threshold for the time on record. Heightening fears of a potential global trade war and stagflation in the United States intensify safe-haven demand for the traditional store of value, Gold.

USD/JPY extends the slide to test 149.00 as trade war fears ramp up risk aversion
USD/JPY extends losses to test 149.00 in Monday's Asian trading. Hawkish BoJ expectations and the risk-off mood amid rising trade tensions underpin the safe-haven Japnese Yen. Moreover, fears of stagflation in the US keep the US Dollar undermined, adding to the pair's downslide.

AUD/USD clings to recovery gains near 0.6300 after China's NBS PMIs
AUD/USD is holding its rebound at around 0.6300 in the Asian session on Monday. Mixed Chinese NBS March PMI data, Australia's hot private inflation data and broad US Dollar weakness help the latest upswing in the pair. But the further upside appears limited due to Trump's tariff concerns.

Week ahead: US NFP and Eurozone CPI awaited as tariff war heats up, RBA meets
Trump’s reciprocal tariffs could spur more chaos. US jobs report might show DOGE impact on labour market. Eurozone inflation will be vital for ECB bets as April cut uncertain. RBA to likely hold rates; Canadian jobs, BoJ Tankan survey also on tap.

US: Trump's 'Liberation day' – What to expect?
Trump has so far enacted tariff changes that have lifted the trade-weighted average tariff rate on all US imports by around 5.5-6.0%-points. While re-rerouting of trade will decrease the effectiveness of tariffs over time, the current level is already close to the highest since the second world war.

The Best brokers to trade EUR/USD
SPONSORED Discover the top brokers for trading EUR/USD in 2025. Our list features brokers with competitive spreads, fast execution, and powerful platforms. Whether you're a beginner or an expert, find the right partner to navigate the dynamic Forex market.