Silver Price Analysis: XAG/USD makes a U-turn and slides below $31.00
- Silver retreats over 2% yet holds above $30.78 'double bottom' neckline.
- Downward momentum noted, but RSI in bullish range hints at potential rebound.
- Key support at $30.50; further levels at $30.00 and $29.82/79 zone.
- Resistance points at $31.00, $31.75, $32.15, aiming for the YTD high of $32.51.

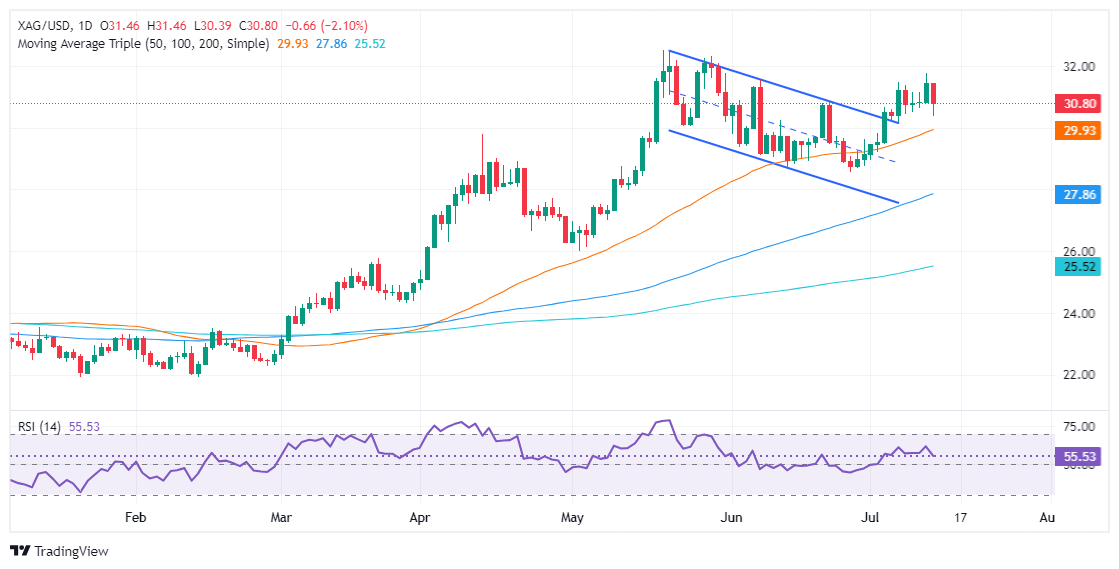
Silver price reversed course and registered losses of more than 2% on Friday, though it remained above the ‘double bottom’ neckline, keeping the short-term uptrend alive. At the time of writing, the XAG/USD trades at $30.78 after hitting a daily high of $31.43.
XAG/USD Price Analysis: Technical outlook
Silver’s daily chart depicts the grey metal’s uptrend is in play, but Friday's price action hints that sellers stepped in aggressively, achieving a daily close near Thursday’s open at $30.79.
Momentum tilted to the downside, as depicted by the Relative Strength Index (RSI), which aimed lower but stood in bullish territory. Hence, XAG/USD could be headed for a pullback before the uptrend continues.
If XAG/USD drops below the psychological $30.50 figure, that could drive the spot price toward the $30.00 level. Once cleared, the next stop would be the confluence of the April 12 high and the 50-day moving average (DMA) at $29.82/79.
On the flip side, the XAG/USD first resistance would be $31.00. Once cleared, the next resistance would be $31.75, followed by the $32.00 psychological figures. Once surpassed, the May 29 peak of $32.15 emerges, ahead of the year-to-date (YTD) high at $32.51. Further gains are seen above the latter.
XAG/USD Price Action – Daily Chart
Silver FAQs
Silver is a precious metal highly traded among investors. It has been historically used as a store of value and a medium of exchange. Although less popular than Gold, traders may turn to Silver to diversify their investment portfolio, for its intrinsic value or as a potential hedge during high-inflation periods. Investors can buy physical Silver, in coins or in bars, or trade it through vehicles such as Exchange Traded Funds, which track its price on international markets.
Silver prices can move due to a wide range of factors. Geopolitical instability or fears of a deep recession can make Silver price escalate due to its safe-haven status, although to a lesser extent than Gold's. As a yieldless asset, Silver tends to rise with lower interest rates. Its moves also depend on how the US Dollar (USD) behaves as the asset is priced in dollars (XAG/USD). A strong Dollar tends to keep the price of Silver at bay, whereas a weaker Dollar is likely to propel prices up. Other factors such as investment demand, mining supply – Silver is much more abundant than Gold – and recycling rates can also affect prices.
Silver is widely used in industry, particularly in sectors such as electronics or solar energy, as it has one of the highest electric conductivity of all metals – more than Copper and Gold. A surge in demand can increase prices, while a decline tends to lower them. Dynamics in the US, Chinese and Indian economies can also contribute to price swings: for the US and particularly China, their big industrial sectors use Silver in various processes; in India, consumers’ demand for the precious metal for jewellery also plays a key role in setting prices.
Silver prices tend to follow Gold's moves. When Gold prices rise, Silver typically follows suit, as their status as safe-haven assets is similar. The Gold/Silver ratio, which shows the number of ounces of Silver needed to equal the value of one ounce of Gold, may help to determine the relative valuation between both metals. Some investors may consider a high ratio as an indicator that Silver is undervalued, or Gold is overvalued. On the contrary, a low ratio might suggest that Gold is undervalued relative to Silver.
Author

Christian Borjon Valencia
FXStreet
Markets analyst, news editor, and trading instructor with over 14 years of experience across FX, commodities, US equity indices, and global macro markets.