Silver Price Analysis: XAG/USD hovers around $22.80, grapples with 50-DMA in lackluster trade
- Silver price seesaw from daily high of $23.69 to low of $22.88, closing at $22.81.
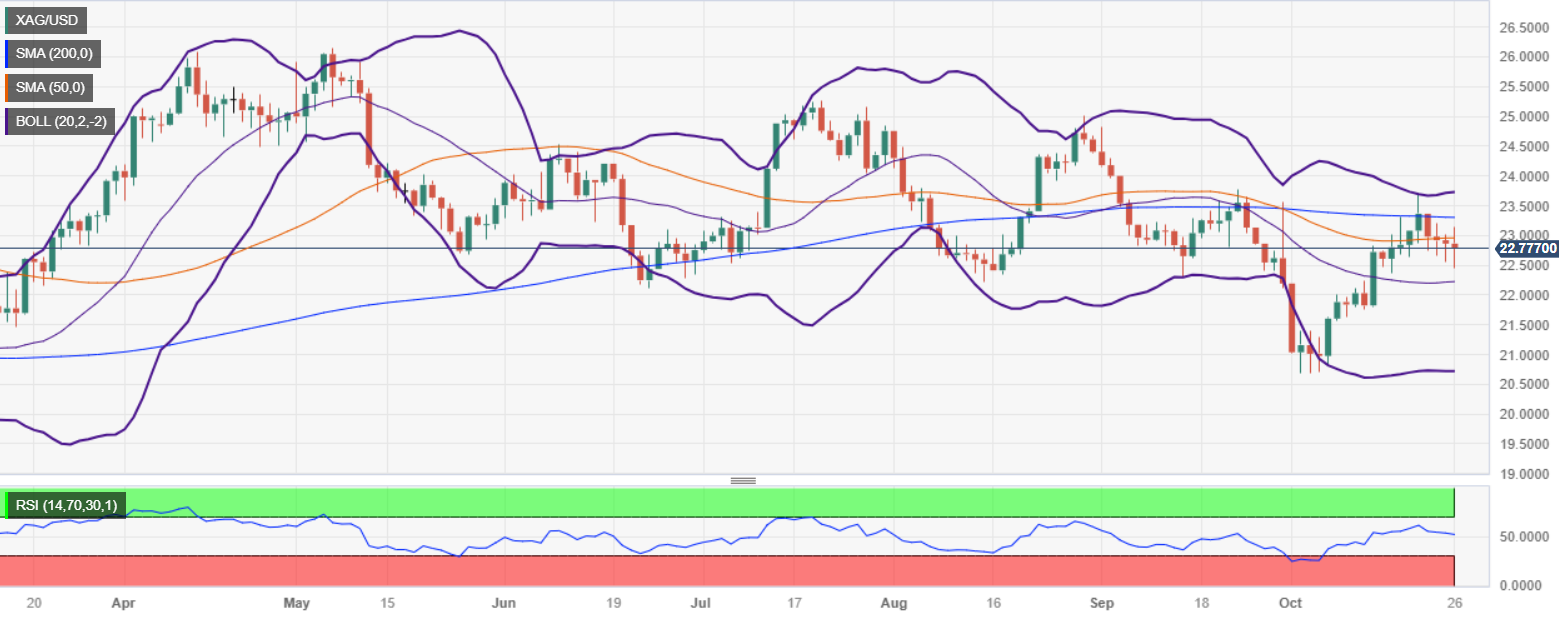
- Key resistance levels at 50-DMA of $22.94 and 200-DMA of $23.29 cap potential rally attempts.
- Downside support at $23.00, with further levels at the October 26 low of $22.44 and 20-day EMA of $22.21.

Silver price (XAG/USD) is almost flat during Thursday’s session after seesawing in a volatile day, reaching a daily high of $23.69 before diving towards its low of $22.88. As the Wall Street close looms, the XAG/USD trades at $22.81, registering losses of 0.12%.
The daily chart portrays the pair as neutral to downward biased, as the XAG/USD sits below the 50 and 200-day moving averages (DMAs), which would cap any rallies intents at $22.94 (50-DMA) and $23.29 (200-DMA). If those two levels are cleared, the next stop would be the top of the Bollinger-Band at $23.71, followed by $24.00.
On the downside, the first key support level lies at $23.00, followed by the October 26 low of $22.44. A breach of the latter would expose the 20-day Exponential Moving Average (EMA) at $22.21, before challenging the $22.00 mark.
XAG/USD Price Action – Daily chart
XAG/USD Technical Levels
Author

Christian Borjon Valencia
FXStreet
Markets analyst, news editor, and trading instructor with over 14 years of experience across FX, commodities, US equity indices, and global macro markets.


