- Silver builds on last week’s modest bounce from the lowest level since May 9.
- The technical setup warrants caution before positioning for any further gains.
- The $27.45 area, or the multi-month low, is the last line of defence for bulls.
Silver (XAG/USD) trades with a positive bias for the second straight day on Monday and moves further away from its lowest level since May 9 touched last week. The white metal currently trades just above the $28.00 mark, up over 0.50% for the day, though the technical setup warrants some caution before positioning for any further appreciating move.
Last week's sustained breakdown through the $28.65-$28.60 horizontal support or the June swing low, which coincided with the 100-day Simple Moving Average (SMA), was seen as a fresh trigger for bearish traders. Moreover, oscillators on the daily chart are holding in negative territory and are still far from being in the oversold zone. This suggests that the path of least resistance for the XAU/USD is to the downside and supports prospects for the emergence of fresh selling at higher levels.
Hence, any subsequent move up is more likely to attract fresh sellers and remain capped near the $28.55-$28.60 zone, or the 100-day SMA support breakpoint. The said area should now act as a key pivotal point, which if cleared decisively might trigger a short-covering rally and allow the XAG/USD to reclaim the $29.00 round-figure mark. The momentum could extend further towards the next relevant hurdle near the $29.40-$29.45 supply zone, coinciding with last week's swing high.
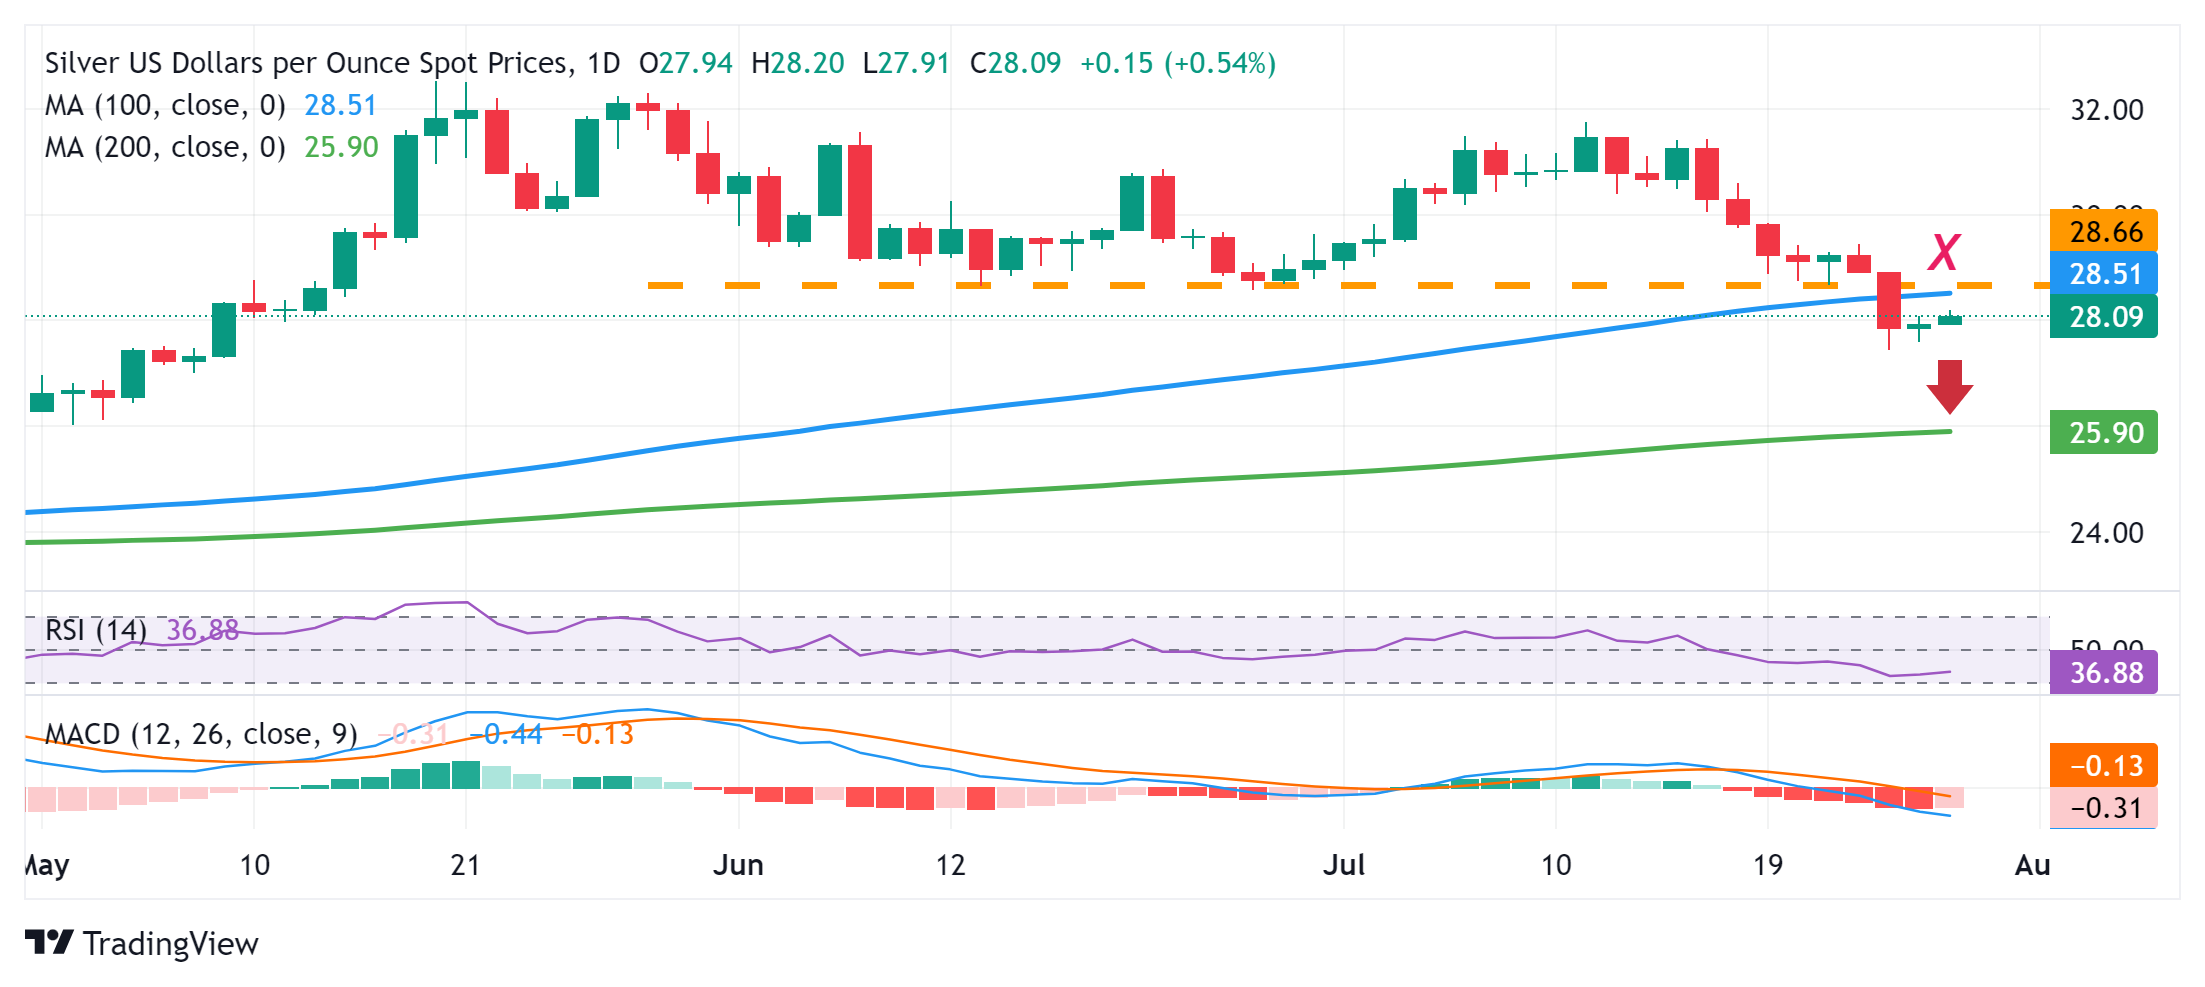
On the flip side, the $27.45 region, or the multi-month low set last Thursday, now seems to act as an immediate strong support. Some follow-through selling will reaffirm the near-term negative outlook and make the XAG/USD vulnerable to accelerate the fall to the $27.00 mark. The white metal could weaken further below the $26.60-$26.55 intermediate support and eventually drop to the very important 200-day SMA support, currently pegged just below the $26.00 round figure.
Silver daily chart
Silver FAQs
Silver is a precious metal highly traded among investors. It has been historically used as a store of value and a medium of exchange. Although less popular than Gold, traders may turn to Silver to diversify their investment portfolio, for its intrinsic value or as a potential hedge during high-inflation periods. Investors can buy physical Silver, in coins or in bars, or trade it through vehicles such as Exchange Traded Funds, which track its price on international markets.
Silver prices can move due to a wide range of factors. Geopolitical instability or fears of a deep recession can make Silver price escalate due to its safe-haven status, although to a lesser extent than Gold's. As a yieldless asset, Silver tends to rise with lower interest rates. Its moves also depend on how the US Dollar (USD) behaves as the asset is priced in dollars (XAG/USD). A strong Dollar tends to keep the price of Silver at bay, whereas a weaker Dollar is likely to propel prices up. Other factors such as investment demand, mining supply – Silver is much more abundant than Gold – and recycling rates can also affect prices.
Silver is widely used in industry, particularly in sectors such as electronics or solar energy, as it has one of the highest electric conductivity of all metals – more than Copper and Gold. A surge in demand can increase prices, while a decline tends to lower them. Dynamics in the US, Chinese and Indian economies can also contribute to price swings: for the US and particularly China, their big industrial sectors use Silver in various processes; in India, consumers’ demand for the precious metal for jewellery also plays a key role in setting prices.
Silver prices tend to follow Gold's moves. When Gold prices rise, Silver typically follows suit, as their status as safe-haven assets is similar. The Gold/Silver ratio, which shows the number of ounces of Silver needed to equal the value of one ounce of Gold, may help to determine the relative valuation between both metals. Some investors may consider a high ratio as an indicator that Silver is undervalued, or Gold is overvalued. On the contrary, a low ratio might suggest that Gold is undervalued relative to Silver.
Information on these pages contains forward-looking statements that involve risks and uncertainties. Markets and instruments profiled on this page are for informational purposes only and should not in any way come across as a recommendation to buy or sell in these assets. You should do your own thorough research before making any investment decisions. FXStreet does not in any way guarantee that this information is free from mistakes, errors, or material misstatements. It also does not guarantee that this information is of a timely nature. Investing in Open Markets involves a great deal of risk, including the loss of all or a portion of your investment, as well as emotional distress. All risks, losses and costs associated with investing, including total loss of principal, are your responsibility. The views and opinions expressed in this article are those of the authors and do not necessarily reflect the official policy or position of FXStreet nor its advertisers. The author will not be held responsible for information that is found at the end of links posted on this page.
If not otherwise explicitly mentioned in the body of the article, at the time of writing, the author has no position in any stock mentioned in this article and no business relationship with any company mentioned. The author has not received compensation for writing this article, other than from FXStreet.
FXStreet and the author do not provide personalized recommendations. The author makes no representations as to the accuracy, completeness, or suitability of this information. FXStreet and the author will not be liable for any errors, omissions or any losses, injuries or damages arising from this information and its display or use. Errors and omissions excepted.
The author and FXStreet are not registered investment advisors and nothing in this article is intended to be investment advice.
Recommended content
Editors’ Picks

USD/JPY remains below 158.00 after Japanese data
Soft US Dollar demand helps the Japanese Yen to trim part of its recent losses, with USD/JPY changing hands around 157.70. Higher than anticipated Tokyo inflation passed unnoticed.

AUD/USD weakens to near 0.6200 amid thin trading
The AUD/USD pair remains on the defensive around 0.6215 during the early Asian session on Friday. The incoming Donald Trump administration is expected to boost growth and lift inflation, supporting the US Dollar (USD). The markets are likely to be quiet ahead of next week’s New Year holiday.

Gold hovers around $2,630 in thin trading
The US Dollar returns from the Christmas holidays with a soft tone, although market action seems contained. The positive tone of Asian shares weighs on the Greenback.
Floki DAO floats liquidity provisioning for a Floki ETP in Europe
Floki DAO — the organization that manages the memecoin Floki — has proposed allocating a portion of its treasury to an asset manager in a bid to launch an exchange-traded product (ETP) in Europe, allowing institutional investors to gain exposure to the memecoin.

2025 outlook: What is next for developed economies and currencies?
As the door closes in 2024, and while the year feels like it has passed in the blink of an eye, a lot has happened. If I had to summarise it all in four words, it would be: ‘a year of surprises’.

Best Forex Brokers with Low Spreads
VERIFIED Low spreads are crucial for reducing trading costs. Explore top Forex brokers offering competitive spreads and high leverage. Compare options for EUR/USD, GBP/USD, USD/JPY, and Gold.