|

Silver Price Analysis: XAG/USD hangs near multi-week low, bears await a break below 61.8% Fibo.

  • Silver remains under some selling pressure for the fourth straight day on Friday.
  • The technical setup favours bears and supports prospects for a further downfall.
  • A sustained strength back above the $24.00 mark might negate the negative bias.

Silver comes under some renewed selling pressure during the early European session on Friday and drops to over a three-week low in the last hour. The white metal currently trades around the $23.40 area, down for the fourth straight day, and seems vulnerable to prolonging its downward trajectory witnessed over the past two weeks or so.

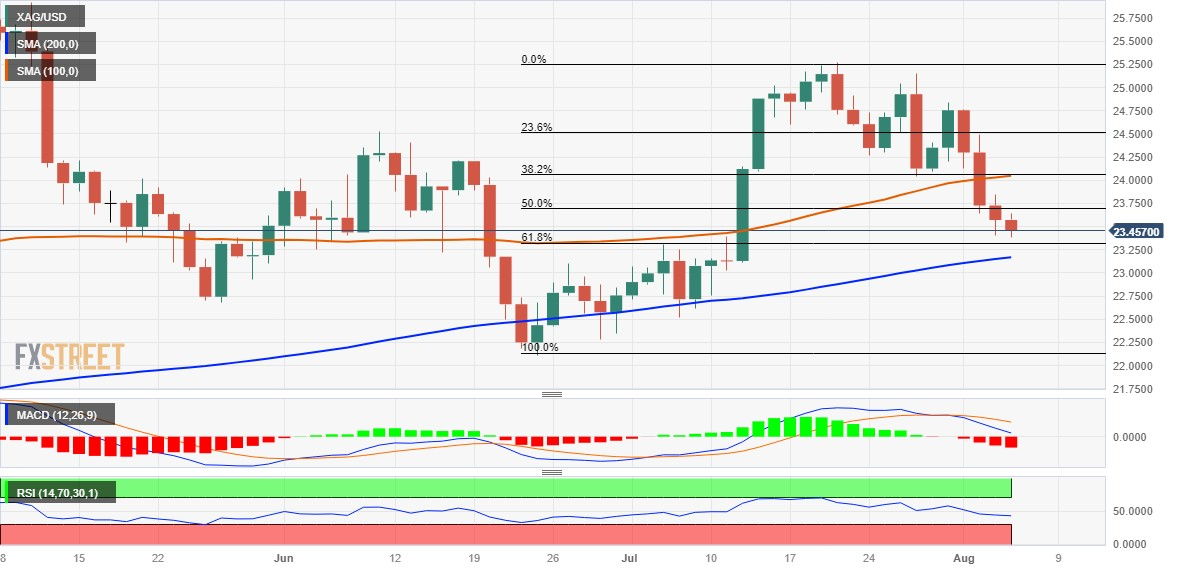
The negative outlook is reinforced by the fact that technical indicators on the daily chart have been drifting lower and are still far from being in the oversold territory. Bearish traders, however, might still wait for a sustained break and acceptance below the $23.35 area, or the 61.8% Fibonacci retracement level of the June-July rally, before positioning for any further losses.

The XAG/USD might then accelerate the slide towards challenging the very important 200-day Simple Moving Average (SMA), currently pegged around the $23.00 mark. The downward trajectory could get extended and make silver vulnerable to retest the multi-month low, around the $22.15-$22.10 area touched in June, before eventually breaking below the $22.00 mark.

On the flip side, the 50% Fibo. level, around the $23.70 area, now seems to act as an immediate hurdle. Any subsequent move up is likely to attract fresh sellers and remain capped near the $24.00-$24.10 confluence support breakpoint, turned resistance. The said area comprises the 100-day SMA and the 38.2% Fibo. level, which should act as a pivotal point.

A sustained strength beyond might trigger a short-covering rally and lift the XAG/USD back towards the 23.6% Fibo. level, around $24.45-$24.50 supply zone. Some follow-through buying has the potential to lift Siver towards the $24.75 intermediate hurdle en route to the $25.00 psychological mark and the next relevant barrier near the $25.25 supply zone.

Silver daily chart

fxsoriginal

Technical levels to watch

XAG/USD

Overview
Today last price23.42
Today Daily Change-0.15
Today Daily Change %-0.64
Today daily open23.57
 
Trends
Daily SMA2024.32
Daily SMA5023.72
Daily SMA10024.03
Daily SMA20023.15
 
Levels
Previous Daily High23.84
Previous Daily Low23.41
Previous Weekly High25.15
Previous Weekly Low24.04
Previous Monthly High25.27
Previous Monthly Low22.52
Daily Fibonacci 38.2%23.57
Daily Fibonacci 61.8%23.68
Daily Pivot Point S123.37
Daily Pivot Point S223.17
Daily Pivot Point S322.94
Daily Pivot Point R123.81
Daily Pivot Point R224.04
Daily Pivot Point R324.24

Author

Haresh Menghani

Haresh Menghani is a detail-oriented professional with 10+ years of extensive experience in analysing the global financial markets.

More from Haresh Menghani
Share:

Markets move fast. We move first.

Orange Juice Newsletter brings you expert driven insights - not headlines. Every day on your inbox.

By subscribing you agree to our Terms and conditions.

Editor's Picks

EUR/USD clings to small gains near 1.1750

Following a short-lasting correction in the early European session, EUR/USD regains its traction and clings to moderate gains at around 1.1750 on Monday. Nevertheless, the pair's volatility remains low, with investors awaiting this weeks key US data releases and the ECB policy announcements.

GBP/USD edges higher toward 1.3400 as traders await key data and BoE

GBP/USD reverses its direction and advances toward 1.3400 following a drop to the 1.3350 area earlier in the day. The US Dollar struggles to gather recovery momentum as markets await Tuesday's Nonfarm Payrolls data, while the Pound Sterling holds steady ahead of the BoE policy announcements later in the week.

Gold builds on previous week's gains, approaches $4,350

Gold preserves its bullish momentum after rising more than 2% last week and climbs toward $4,350 on Monday. The precious metal extends its upside as the US Dollar remains on the back foot on growing expectations for a dovish Fed policy outlook next year.

Solana consolidates as spot ETF inflows near $1 billion signal institutional dip-buying

Solana price hovers above $131 at the time of writing on Monday, nearing the upper boundary of a falling wedge pattern, awaiting a decisive breakout. On the institutional side, demand for spot Solana Exchange-Traded Funds remained firm, pushing total assets under management to nearly $1 billion since launch. 

Big week ends with big doubts

The S&P 500 continued to push higher yesterday as the US 2-year yield wavered around the 3.50% mark following a Federal Reserve (Fed) rate cut earlier this week that was ultimately perceived as not that hawkish after all. The cut is especially boosting the non-tech pockets of the market.

Solana Price Forecast: SOL consolidates as spot ETF inflows near $1 billion signal institutional dip-buying

Solana (SOL) price hovers above $131 at the time of writing on Monday, nearing the upper boundary of a falling wedge pattern, awaiting a decisive breakout.