|

Silver Price Analysis: XAG/USD floats around $23.60, as high US bond yields dented

  • Silver prices edge toward $23.60 following a dip below $24.00 last week, as US Treasury bond yields surge to 3.721%, curbing safe-haven appetite and softening the USD’s fall.
  • XAG/USD holds its double-top chart pattern below the neckline. Although a failure to cross the 100-day EMA at $23.50 hints at the bullish sentiment, a bearish RSI suggests possible retesting.
  • If XAG/USD breaks below the 100-day EMA, it eyes $23.00 and then the pivotal 200-day EMA at $22.82.

Silver price retraces toward the $23.60 area after falling below the $24.00 figure in the last week, courtesy of higher US Treasury bond yields, with the 10-year benchmark note rate at 3.721%, climbing more than four basis points. That dented the appetite for safe-haven assets, namely Gold and Silver prices, and cushioned the fall of the US Dollar. At the time of writing, the XAG/USD is trading at $23.62, almost flat as the Asian session begins.

XAG/USD Price Analysis: Technical outlook

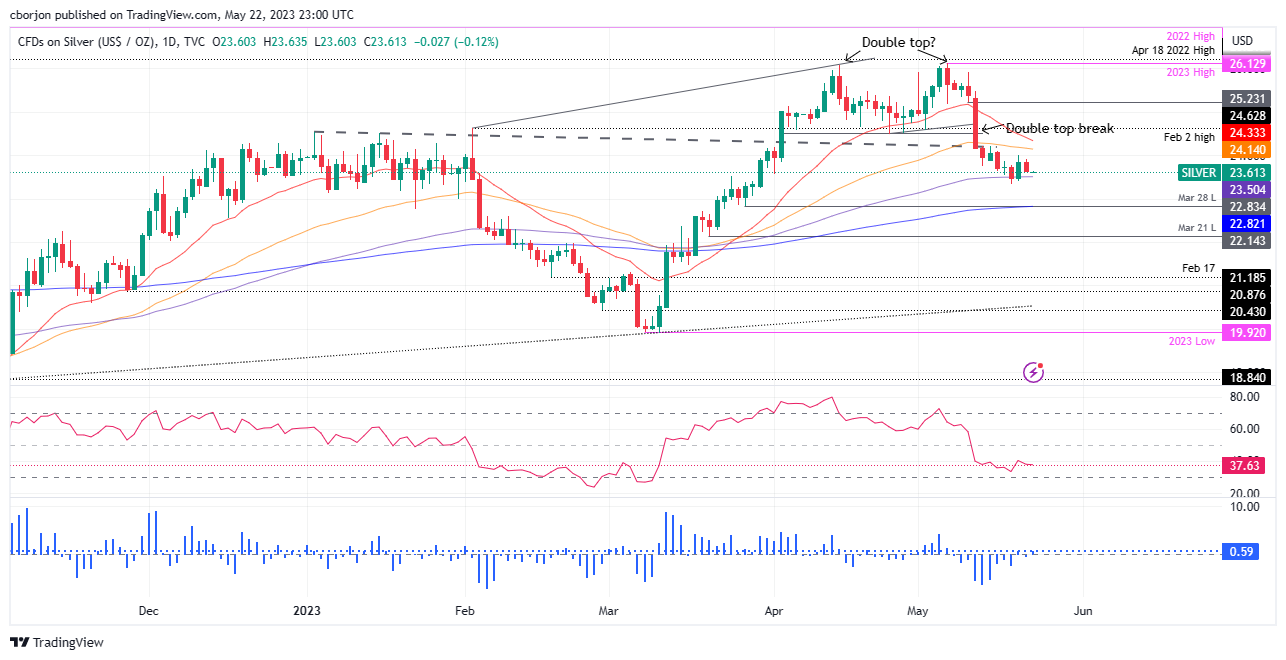
The XAG/USD continues to validate a double-top chart pattern, with the XAG/USD’s spot price remaining below the double-top neckline. Failure to break below the 100-day Exponential Moving Average (EMA) at $23.50 keeps Silver buyers hopeful for higher prices. Nevertheless, the Relative Strength Index (RSI) indicator remains bearish, suggesting that the 100-day EMA could be retested soon.

If XAG/USD breaks below the latter, the next support would be the $23.00 figure before testing the “trendsetter” 200-day EMA at $22.82. Once broken, XAG/USD will turn bearish and be exposed to test lower prices. Firstly, the March 28 daily low at $22.83, followed by the March 21 swing low of $22.14.

On the other hand, for XAG/USD’s bullish continuation, Silver must reclaim the $24.00 mark, a troy ounce, followed by the 50-day EMA at $24.14. Once cleared, XAG/USD’s next resistance would be the 20-day EMA at $24.33, ahead of double-top neckline cracking.

XAG/USD Price Action – Daily chart

XAG/USD Daily chart

XAG/USD

Overview
Today last price23.63
Today Daily Change-0.22
Today Daily Change %-0.92
Today daily open23.85
 
Trends
Daily SMA2024.82
Daily SMA5024.2
Daily SMA10023.39
Daily SMA20021.94
 
Levels
Previous Daily High24.02
Previous Daily Low23.4
Previous Weekly High24.21
Previous Weekly Low23.33
Previous Monthly High26.09
Previous Monthly Low23.57
Daily Fibonacci 38.2%23.78
Daily Fibonacci 61.8%23.63
Daily Pivot Point S123.49
Daily Pivot Point S223.14
Daily Pivot Point S322.87
Daily Pivot Point R124.11
Daily Pivot Point R224.38
Daily Pivot Point R324.73

Author

Christian Borjon Valencia

Christian Borjon began his career as a retail trader in 2010, mainly focused on technical analysis and strategies around it. He started as a swing trader, as he used to work in another industry unrelated to the financial markets.

More from Christian Borjon Valencia
Share:

Markets move fast. We move first.

Orange Juice Newsletter brings you expert driven insights - not headlines. Every day on your inbox.

By subscribing you agree to our Terms and conditions.

Editor's Picks

EUR/USD steadies near 1.1750 ahead of final Eurozone CPI amid fading USD recovery

The EUR/USD pair steadies around the 1.1750 area during the Asian session on Wednesday, and for now, seems to have stalled the previous day's sharp retracement slide from the highest level since September 24. Meanwhile, the fundamental backdrop remains tilted in favor of bullish traders and suggests that the path of least resistance for spot prices remains to the upside.

GBP/USD gains ground above 1.3400 on UK PMI optimism

The GBP/USD pair gains momentum to around 1.3425 during the early Asian session on Wednesday. The Pound Sterling edges higher against the Greenback on the upbeat UK preliminary S&P Global Purchasing Managers' Index data. Traders will take more cues from the Fedspeak later on Wednesday. 

Gold advances to near seven-week highs amid US labor market cooling

Gold price extends its upside to near seven-week highs above $4,300 during the Asian trading hours on Wednesday. The precious metal gains momentum as the US labor market remains relatively resilient but shows signs of slowing. The mixed US employment report for November reinforces bets of further rate cuts by the US Federal Reserve and weighs on the US Dollar.

Top Crypto Gainers: SPX6900, Pi Network, Filecoin – Sudden rebound lifts bullish spirit

SPX6900, Pi Network, and Filecoin emerge as top gainers in the last 24 hours as the broader cryptocurrency market remains under bearish pressure. The sudden rebound in SPX, PI, and FIL suggests a possible rally, as the Moving Average Convergence Divergence indicator on the 4-hour chart flashes a buy signal. 

Ukraine-Russia in the spotlight once again

Since the start of the week, gold’s price has moved lower, but has yet to erase the gains made last week. In today’s report we intend to focus on the newest round of peace talks between Russia and Ukraine, whilst noting the release of the US Employment data later on day and end our report with an update in regards to the tensions brewing in Venezuela.

BNB Price Forecast: BNB slips below $855 as bearish on-chain signals and momentum indicators turn negative

BNB, formerly known as Binance Coin, continues to trade down around $855 at the time of writing on Tuesday, after a slight decline the previous day. Bearish sentiment further strengthens as BNB’s on-chain and derivatives data show rising retail activity.