Silver Price Analysis: XAG/USD en route to $22.00 on bearish triangle break
- Silver remains pressured towards yearly low despite the recent corrective pullback.
- Confirmation of a bearish chart pattern joins steady RSI to favor sellers.
- 13-day-old resistance line, 100-SMA add to the upside filters.

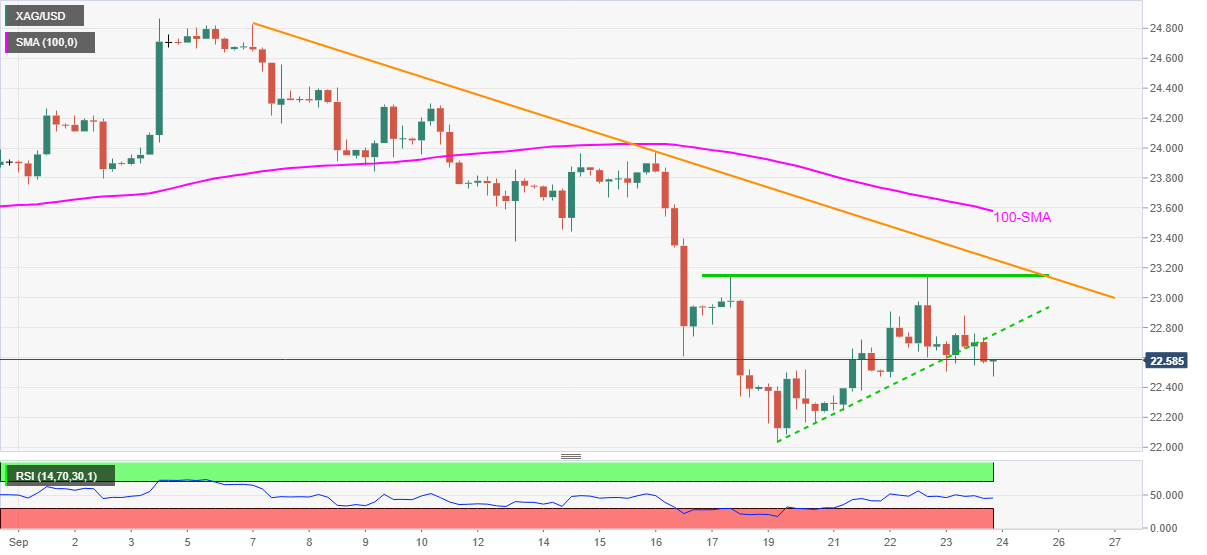
Silver (XAG/USD) licks its wounds around $22.60 up 0.28% intraday during Friday’s Asian session.
Even so, the bright metal keeps the previous day’s downside break of a one-week-old rising triangle breakdown.
Given the absence of oversold RSI conditions and sustained trading below the short-term resistance line, as well as 100-SMA, silver prices are likely directed towards the south.
Hence, the monthly low, also the 2021 bottom near $22.00 gain the market’s attention of late.
However, any further downside will be challenged by the September 2020 lows surrounding $21.65, a break of which will drag the quote to the July 2016 peak near $21.15.
Meanwhile, the corrective pullback may aim for the support-turned-resistance line, at $22.75 by the press time, before heading towards the double top near $23.15.
It’s worth noting that the commodity upside past $23.15 will be challenged by a descending resistance line from September 07 and 100-SMA, around $23.25 and $23.60 in that order.
Silver: Four-hour chart
Trend: Further weakness expected
Author

Anil Panchal
FXStreet
Anil Panchal has nearly 15 years of experience in tracking financial markets. With a keen interest in macroeconomics, Anil aptly tracks global news/updates and stays well-informed about the global financial moves and their implications.


