|

Silver Price Analysis: XAG/USD edges up, maintain its bullish bias, buyers target $24.00

  • Silver price stays firm, despite subdued trading conditions.
  • Key resistance levels in focus for XAG/USD, with $24.00 as immediate hurdle, followed by June high at $24.52.
  • Downside risks include potential drop below the 200-DMA at $23.32 as a critical support to watch.

Silver price advanced on Thursday by 0.91%, amid low volume conditions, and as the Asian Pacific session begins, trades at around $23.82, unchanged in the early Friday session, as Japan and the US markets, reopen after being on holiday.

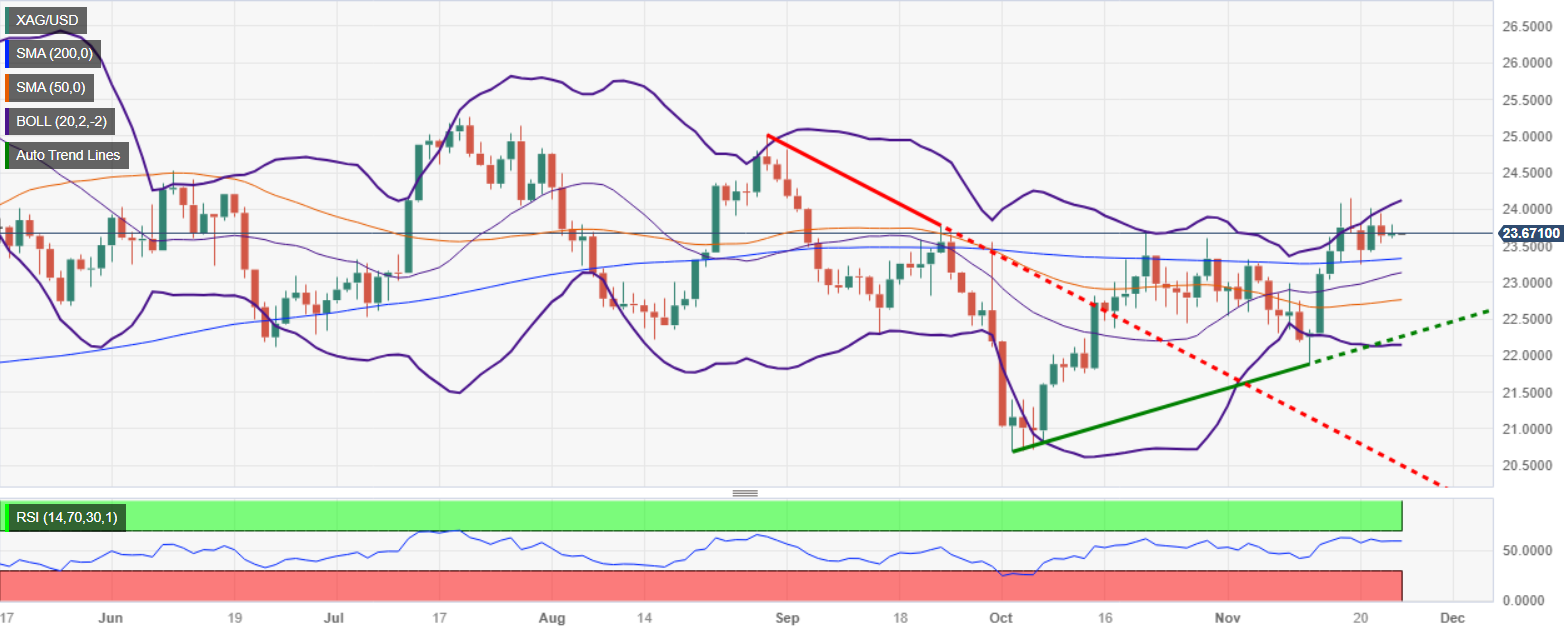
Silver daily chart portrays the grey metal as neutral to upward biased but remains near the weekly highs, which could pave the way for a test of the $24.00 figure. Once cleared, the next resistance would be the Jun 9 high at $24.52 before XAG/USD climbs to $25.00. Once surpassed, that would cement the uptrend, and expose the year-to-date (YTD) high at $26.12.

Conversely, if XAG/USD falls below the November 23 low of $23.60, that could pave the way for testing the 200-day moving average (DMA) at $23.32. If sellers drag prices below that demand zone, the XAG/USD would shift neutral bearish, and expose the 20-DMA at $23.13, followed by the 50-DMA at $22.75.

XAG/USD Price Analysis – Daily Chart

XAG/USD Technical Levels

XAG/USD

Overview
Today last price23.67
Today Daily Change0.03
Today Daily Change %0.13
Today daily open23.64
 
Trends
Daily SMA2023.06
Daily SMA5022.73
Daily SMA10023.23
Daily SMA20023.31
 
Levels
Previous Daily High23.94
Previous Daily Low23.54
Previous Weekly High24.15
Previous Weekly Low21.88
Previous Monthly High23.7
Previous Monthly Low20.68
Daily Fibonacci 38.2%23.69
Daily Fibonacci 61.8%23.79
Daily Pivot Point S123.47
Daily Pivot Point S223.3
Daily Pivot Point S323.06
Daily Pivot Point R123.88
Daily Pivot Point R224.11
Daily Pivot Point R324.28

Author

Christian Borjon Valencia

Markets analyst, news editor, and trading instructor with over 14 years of experience across FX, commodities, US equity indices, and global macro markets.

More from Christian Borjon Valencia
Share:

Editor's Picks

EUR/USD slumps below 1.1750 as USD benefits from risk-aversion

EUR/USD comes under renewed bearish pressure in the European session and trades below 1.1750 following a recovery attempt earlier in the day. The US Dollar gathers strength and weighs on the pair as investors seek refuge in the wake of Israel and the United States' joint attack on Iran.

GBP/USD targets 1.3500 barrier near moving averages

GBP/USD rebounds from the daily losses, trading around 1.3450 during the Asian hours on Monday. The technical analysis of the daily chart indicates an ongoing bearish bias, as the pair trades within a descending channel pattern.

Gold surges on safe-haven demand, tests $5,400

Gold benefits from intense risk-aversion on Monday and climbs to the $5,400 region, setting a fresh monthly-high in the process. Tensions in the Middle East remain high as Israel and Hezbollah continue to exchange strikes following the US-Israel joint attack on Iran over the weekend.

Bitcoin on brink of breakdown amid US-Iran war

Bitcoin (BTC) remains under pressure near the key support level of $65,700. Trading at $66,400 at the time of writing on Monday, a breakdown below this critical level would suggest a deeper correction ahead.

The week ahead: Conflict in the Middle East jolts markets

Events in the Middle East are obviously dominating financial markets this morning. The Brent crude oil price is extending gains and is higher by more than 8%, stock futures are pointing lower and the gold price is higher by more than 2%. 

Pi Network Price Forecast: Core team offloads supply, weighing on PI recovery

Pi Network  hovers below $0.1700, broadly steady at press time on Monday, attempting a recovery after a 2% loss the previous day. Sunday’s decline aligned with nearly 49 million PI tokens offloaded by the Pi Foundation, implying a spike in supply pressure that capped the prevailing four-day recovery.