Silver Price Analysis: XAG/USD dips on rising US bond yields as technicals shift bearish
- Silver's decline influenced by high US bond yields, impacting the metal's trading direction.
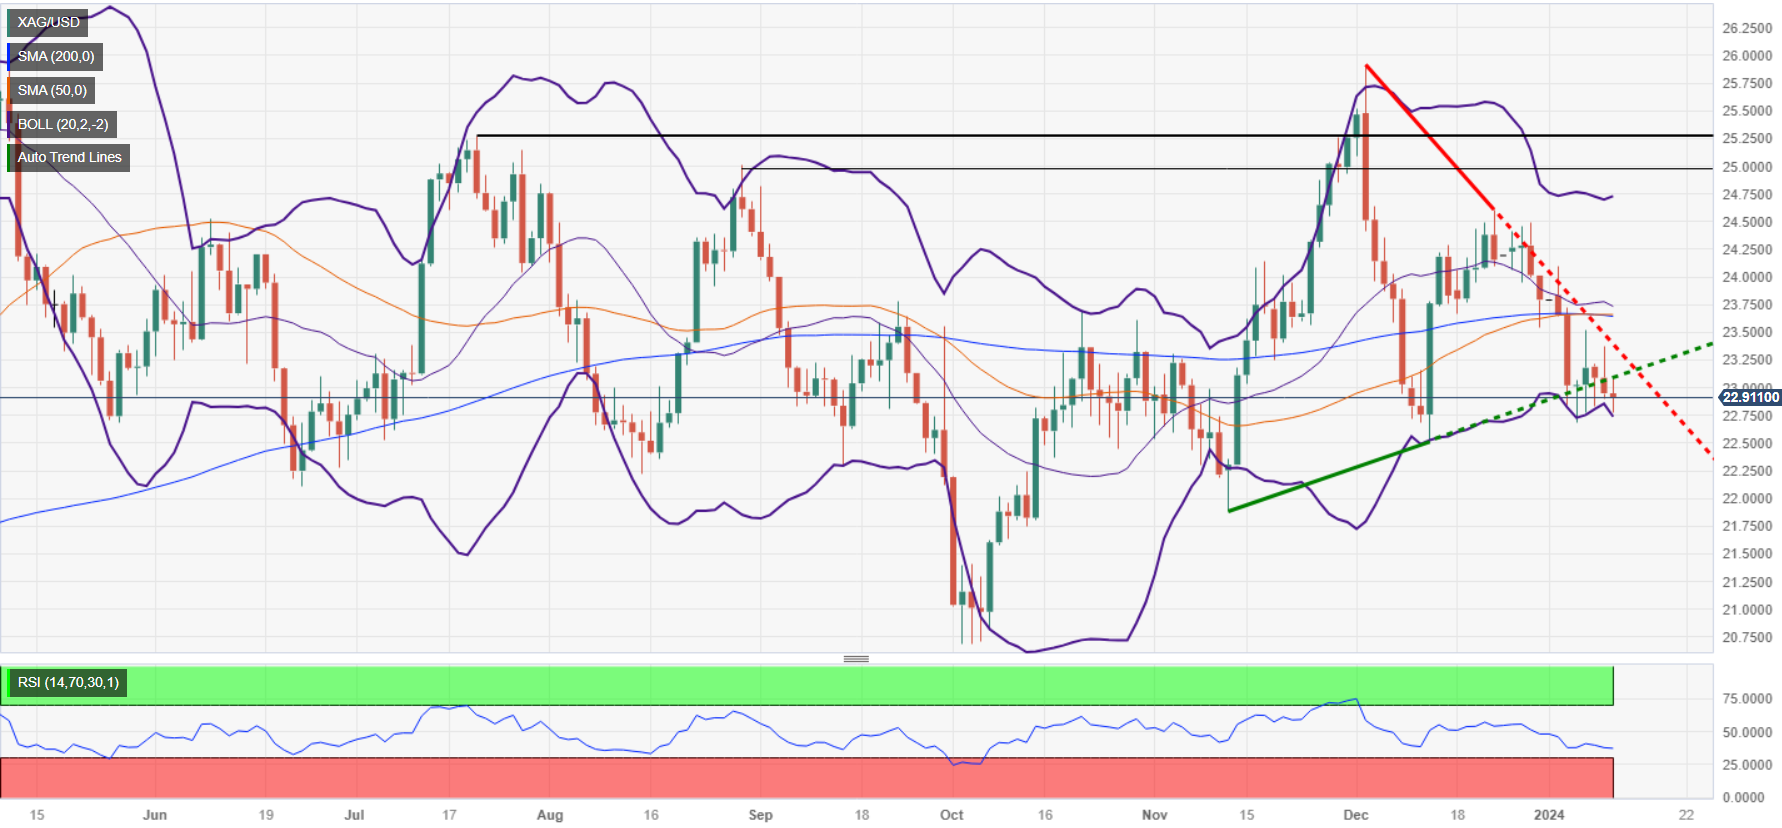
- Technical analysis indicates a sideways yet slightly bearish trend, with key support levels in focus.
- For a potential upward shift, Silver needs to reclaim $23.00 and surpass the 100-DMA at $23.28.

Silver price slumps late in the North American session as high US Treasury bond yields hit precious metals prices across the board. At the time of writing, XAG/USD trades at $22.70 a troy ounce, down 0.24%.
XAG/USD’s daily chart shows the non-yielding metal is trading sideways though slightly tilted to the downside. This is because Silver dropped below the 100-day moving average (DMA) on January 3. Since then, the 100-DMA remains a key resistance level respected by buyers, exacerbating Silver’s fall below $23.00.
That said, the path of least resistance is to the downside. Silver’s first support would be the January 4 low of $22.69, followed by the December 13 swing low of $22.51. Once those two levels are cleared, the next demand area would be $22.00.
Buyers must reclaim the $23.00 figure for a bullish resumption, followed by the 100-DMA at $23.28. A breach of the latter will expose the confluence of the 50 and 200-DMAs around $23.62/65.
XAG/USD Price Action – Daily Chart
XAG/USD Technical Levels
Author

Christian Borjon Valencia
FXStreet
Markets analyst, news editor, and trading instructor with over 14 years of experience across FX, commodities, US equity indices, and global macro markets.


