|

Silver Price Analysis: XAG/USD climbs back above $23.00, upside potential seems limited

  • Silver gains positive traction and snaps an eight-day losing streak to over a two-week low.
  • The technical setup supports prospects for the emergence of fresh selling at higher levels.
  • Bears might wait for a fall below the $22.85-80 region before positioning for further decline.

Silver attracts some buyers on the first day of a new week, snapping an eight-day losing streak, and climbs back above the $23.00 round-figure mark during the Asian session. The white metal, however, remains well within the striking distance of a two-and-half-week low, around the $22.85-$22.80 region retested on Friday, and still seems vulnerable to slide further.

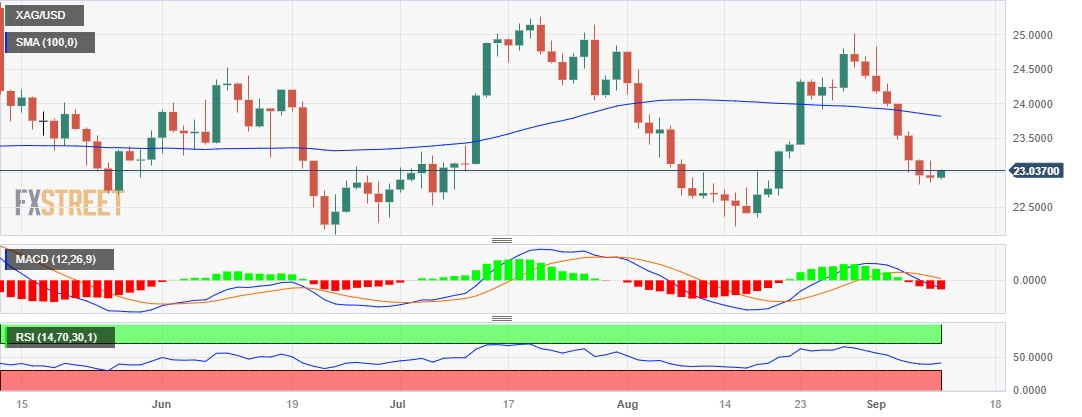
The negative outlook is reinforced by the fact that oscillators on the daily chart have been gaining negative traction and are away from being in the oversold zone. Moreover, the Relative Strength Index (RSI) on the 4-hour chart has also recovered from the oversold territory. This, in turn, suggests that the path of least resistance for the XAG/USD remains to the downside.

Hence, any subsequent move up might still be seen as a selling opportunity and remain capped near the very important 200-day Simple Moving Average (SMA), currently pegged near the $23.45-$23.50 area. This is followed by the 100-day SMA barrier, around the $23.80 region, and the $24.00 mark, which if cleared decisively will negate the negative outlook for the XAG/USD.

The subsequent short-covering move has the potential to lift the white metal beyond the $24.30-$24.35 supply zone, towards reclaiming the $25.00 psychological mark. The latter represents the August monthly swing high and should act as a pivotal point. A sustained strength beyond will be seen as a fresh trigger for bullish traders and pave the way for a further appreciating move.

On the flip side, bearish traders need to wait for some follow-through selling below the $22.85-$22.80 area before placing fresh bets. The XAG/USD might then accelerate the fall below the $22.65-$22.60 support, towards challenging a strong horizontal support near the $22.20-$22.10 zone. This is followed by the $22.00 mark, which if broken will confirm a fresh breakdown.

Silver daily chart

fxsoriginal

Technical levels to watch

XAG/USD

Overview
Today last price23.04
Today Daily Change0.11
Today Daily Change %0.48
Today daily open22.93
 
Trends
Daily SMA2023.56
Daily SMA5023.74
Daily SMA10023.84
Daily SMA20023.47
 
Levels
Previous Daily High23.18
Previous Daily Low22.86
Previous Weekly High24.3
Previous Weekly Low22.83
Previous Monthly High25.02
Previous Monthly Low22.23
Daily Fibonacci 38.2%22.98
Daily Fibonacci 61.8%23.05
Daily Pivot Point S122.8
Daily Pivot Point S222.67
Daily Pivot Point S322.48
Daily Pivot Point R123.12
Daily Pivot Point R223.3
Daily Pivot Point R323.44

Author

Haresh Menghani

Haresh Menghani is a detail-oriented professional with 10+ years of extensive experience in analysing the global financial markets.

More from Haresh Menghani
Share:

Markets move fast. We move first.

Orange Juice Newsletter brings you expert driven insights - not headlines. Every day on your inbox.

By subscribing you agree to our Terms and conditions.

Editor's Picks

EUR/USD clings to small gains near 1.1750

Following a short-lasting correction in the early European session, EUR/USD regains its traction and clings to moderate gains at around 1.1750 on Monday. Nevertheless, the pair's volatility remains low, with investors awaiting this weeks key data releases from the US and the ECB policy announcements.

GBP/USD edges higher toward 1.3400 ahead of US data and BoE

GBP/USD reverses its direction and advances toward 1.3400 following a drop to the 1.3350 area earlier in the day. The US Dollar struggles to gather recovery momentum as markets await Tuesday's Nonfarm Payrolls data, while the Pound Sterling holds steady ahead of the BoE policy announcements later in the week.

Gold stuck around $4,300 as markets turn cautious

Gold loses its bullish momentum and retreats below $4,350 after testing this level earlier on Monday. XAU/USD, however, stays in positive territory as the US Dollar remains on the back foot on growing expectations for a dovish Fed policy outlook next year.

Solana consolidates as spot ETF inflows near $1 billion signal institutional dip-buying

Solana price hovers above $131 at the time of writing on Monday, nearing the upper boundary of a falling wedge pattern, awaiting a decisive breakout. On the institutional side, demand for spot Solana Exchange-Traded Funds remained firm, pushing total assets under management to nearly $1 billion since launch. 

Big week ends with big doubts

The S&P 500 continued to push higher yesterday as the US 2-year yield wavered around the 3.50% mark following a Federal Reserve (Fed) rate cut earlier this week that was ultimately perceived as not that hawkish after all. The cut is especially boosting the non-tech pockets of the market.

Solana Price Forecast: SOL consolidates as spot ETF inflows near $1 billion signal institutional dip-buying

Solana (SOL) price hovers above $131 at the time of writing on Monday, nearing the upper boundary of a falling wedge pattern, awaiting a decisive breakout.