|

Silver Price Analysis: XAG/USD bulls now await move beyond 200-hour SMA/50% Fibo. confluence

  • Silver gains strong positive traction on Friday and recovers further from a two-week low.
  • The mixed technical setup warrants some caution before positioning for any further gains.
  • The $22.70 region should now act as a strong support and a key pivotal point for traders.

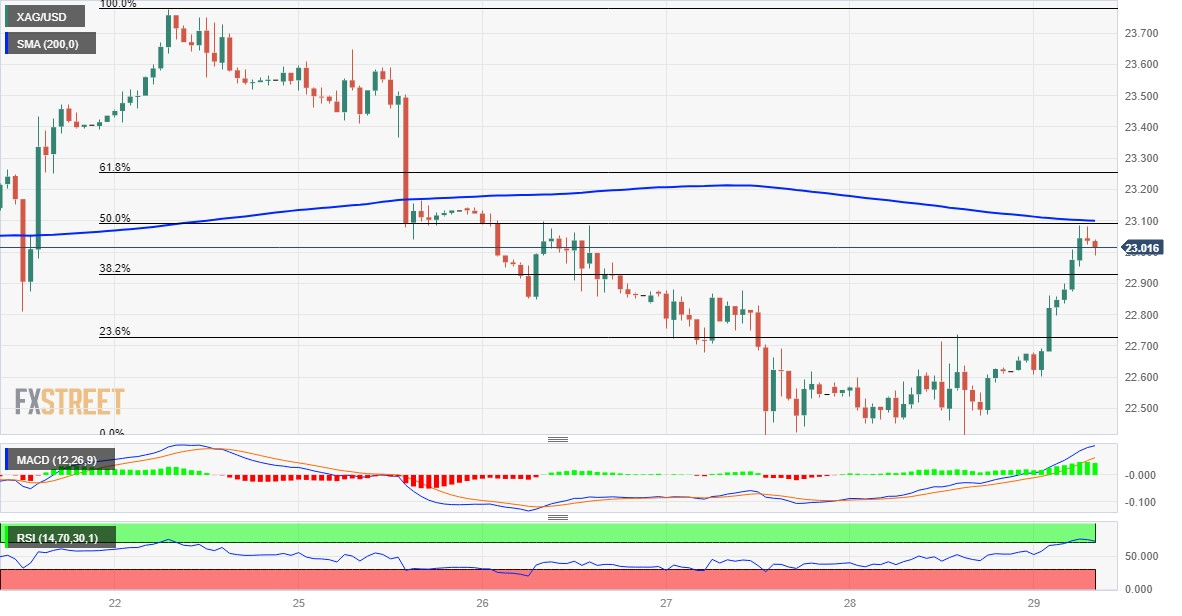
Silver builds on the previous day's bounce from a support marked by an ascending trend line extending from the June swing low, around the $22.40-$22.35 area, or a two-week low, and scales higher for the second successive day on Friday. The strong intraday move up lifts the white metal to a four-day high during the early European session, albeit stalls near the $23.05-$23.10 confluence hurdle.

Technical indicators on the daily chart, meanwhile, are yet to confirm a near-term positive outlook. Moreover, the Relative Strength Index (RSI) on the daily chart is already flashing overbought conditions and capping the XAG/USD. This makes it prudent to wait for a sustained strength beyond the aforementioned barrier, comprising the 200-hour Simple Moving Average (SMA) and the 50% Fibonacci retracement level of the downfall witnessed over the past week or so, before placing fresh bullish bets.

The XAG/USD might then aim to surpass the $23.20-$23.25 resistance and challenge the very important 200-day SMA, around the $23.45 region. This is followed by last week's swing high, around the $23.75 area, above which the momentum could get extended towards the $24.00 round figure en route to the $24.30-$24.35 hurdle. Some follow-through buying should pave the way for a further appreciating move and allow bulls to reclaim the $25.00 psychological mark.

On the flip side, any meaningful corrective slide might now find decent support near the $22.70 area or the 23.6% Fibo. level, below which the XAG/USD could slide to the aforementioned trend-line support, around the $22.40-$22.35 region. A convincing break below the latter will be seen as a fresh trigger for bearish traders and make Silver vulnerable to weaken further below the $22.00 mark. The downward trajectory could get extended towards the $21.25 intermediate support before the white metal eventually drops to the $21.00 level.

Silver 1-hour chart

fxsoriginal

Technical levels to watch

XAG/USD

Overview
Today last price23.01
Today Daily Change0.39
Today Daily Change %1.72
Today daily open22.62
 
Trends
Daily SMA2023.17
Daily SMA5023.49
Daily SMA10023.53
Daily SMA20023.46
 
Levels
Previous Daily High22.74
Previous Daily Low22.4
Previous Weekly High23.78
Previous Weekly Low22.81
Previous Monthly High25.02
Previous Monthly Low22.23
Daily Fibonacci 38.2%22.61
Daily Fibonacci 61.8%22.53
Daily Pivot Point S122.43
Daily Pivot Point S222.25
Daily Pivot Point S322.1
Daily Pivot Point R122.77
Daily Pivot Point R222.92
Daily Pivot Point R323.11

Author

Haresh Menghani

Haresh Menghani is a detail-oriented professional with 10+ years of extensive experience in analysing the global financial markets.

More from Haresh Menghani
Share:

Editor's Picks

EUR/USD recovers some early losses driven by rising energy prices amid US-Iran war

The EUR/USD pair claws back some of its early losses during the late Asian trading session on Monday, but is still 0.25% down to near 1.1780. Earlier in the day, the Euro declined sharply against the US Dollar as investors shifted to the safe-haven fleet amid the brutal war between Iran, Israel, and the United States, which broke out over the weekend.

GBP/USD targets 1.3500 barrier near moving averages

GBP/USD rebounds from the daily losses, trading around 1.3450 during the Asian hours on Monday. The technical analysis of the daily chart indicates an ongoing bearish bias, as the pair trades within a descending channel pattern.

Gold looks further north as Iran war boosts haven demand

Gold is taking a breather after the initial run to over one-month highs near $5,400, kicking off the new week with a bang. A global flight to safety theme, following the US-Israel joint attacks on Iran over the weekend, bolstered the demand for the traditional store of value, Gold.

Bitcoin, Ethereum and Ripple under pressure as key supports face breakdown risk

Bitcoin, Ethereum, and Ripple prices trade on the back foot at the start of this week on Monday, after extending losses in the previous week. BTC is on the brink of a breakdown, ETH is capped below key resistance, and XRP risks a crack of the trendline.

The market is paying for insurance, not apocalypse

As expected, this morning felt less like a Monday market open and more like a fire drill. Futures screens flickered red. S&P contracts down almost 1%. Nasdaq off 1.2%. Brent leaped 13% through $80. Gold rose 1.6% toward $5350 before paring some gains. The dollar is strutting mildly. The Swiss franc is quietly doing what it always does in a storm, catching some safe-haven flows.

Starknet unveils strkBTC, shielded Bitcoin transactions on Ethereum Layer 2

Starknet, the Ethereum Layer 2 network developed by StarkWare, today announced strkBTC, a wrapped Bitcoin asset that introduces optional shielding while preserving full DeFi composability.