|

Silver Price Analysis: XAG/USD bulls await a sustained move beyond 61.8% Fibo. level

  • Silver has been trending higher along an upward sloping channel on the daily chart.
  • The technical set-up favours bullish traders and supports prospects for further gains.
  • Only a sustained break below the $26.00-$25.90 will negate the constructive outlook.

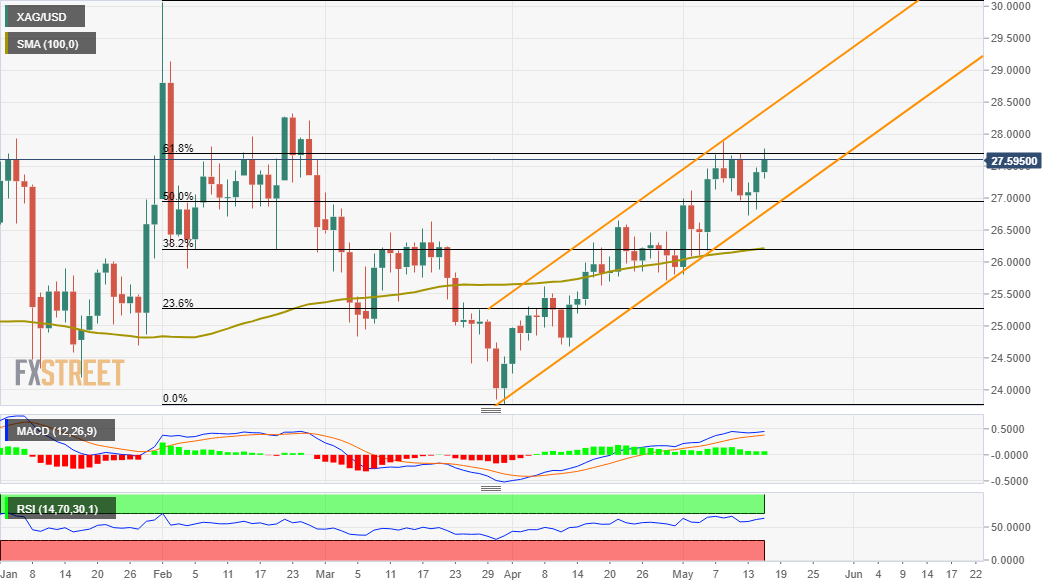
Silver continued with its struggle to capitalize on the move beyond the 61.8% Fibonacci level of the $30.07-$23.78 downfall and trimmed a part of its intraday gains to one-week tops. The commodity was last seen trading around the $27.60-65 region, still up nearly 1.0% for the day.

Looking at the broader picture, the recent strong recovery from YTD lows, around the $23.80-75 region touched on March 31 has been along an upward sloping channel. This points to a well-established bullish trend and supports prospects for a further appreciating move for the XAG/USD.

The constructive set-up is reinforced by the fact that oscillators on hourly/daily charts have been gaining positive traction and are still far from being in the overbought territory. That said, bulls might still wait for a move beyond the $27.75-80 region before placing fresh bets.

The mentioned barrier is closely followed by the $28.00 round-figure mark, which if cleared decisively will reaffirm the bullish outlook. The XAG/USD might then accelerate the momentum further towards testing the $28.25-30 supply zone, which coincides with trend-channel resistance.

Some follow-through buying will mark a fresh breakout and set the stage for additional gains towards reclaiming the $29.00 mark in the near term.

On the flip side, any meaningful pullback might continue to attract some dip-buying and remain limited near the $27.00-$26.90 confluence support. This comprises the lower boundary of the ascending channel and 50% Fibo. level, which if broken will negate the positive bias.

The subsequent selling pressure has the potential to drag the XAG/USD further towards the $26.15-10 area (38.2% Fibo.) en-route the $26.00 mark. Some follow-through selling will expose the $25.00 psychological mark, with some intermediate support near the $25.30-25 zone (23.6% Fibo.).

XAG/USD daily chart

fxsoriginal

Technical levels to watch

XAG/USD

Overview
Today last price27.6
Today Daily Change0.20
Today Daily Change %0.73
Today daily open27.4
 
Trends
Daily SMA2026.61
Daily SMA5025.89
Daily SMA10026.2
Daily SMA20025.66
 
Levels
Previous Daily High27.48
Previous Daily Low26.82
Previous Weekly High27.88
Previous Weekly Low26.72
Previous Monthly High26.64
Previous Monthly Low24.25
Daily Fibonacci 38.2%27.23
Daily Fibonacci 61.8%27.07
Daily Pivot Point S126.99
Daily Pivot Point S226.57
Daily Pivot Point S326.32
Daily Pivot Point R127.65
Daily Pivot Point R227.9
Daily Pivot Point R328.32

Author

Haresh Menghani

Haresh Menghani is a detail-oriented professional with 10+ years of extensive experience in analysing the global financial markets.

More from Haresh Menghani
Share:

Markets move fast. We move first.

Orange Juice Newsletter brings you expert driven insights - not headlines. Every day on your inbox.

By subscribing you agree to our Terms and conditions.

Editor's Picks

EUR/USD clings to small gains near 1.1750

Following a short-lasting correction in the early European session, EUR/USD regains its traction and clings to moderate gains at around 1.1750 on Monday. Nevertheless, the pair's volatility remains low, with investors awaiting this weeks key US data releases and the ECB policy announcements.

GBP/USD edges higher toward 1.3400 as traders await key data and BoE

GBP/USD reverses its direction and advances toward 1.3400 following a drop to the 1.3350 area earlier in the day. The US Dollar struggles to gather recovery momentum as markets await Tuesday's Nonfarm Payrolls data, while the Pound Sterling holds steady ahead of the BoE policy announcements later in the week.

Gold builds on previous week's gains, approaches $4,350

Gold preserves its bullish momentum after rising more than 2% last week and climbs toward $4,350 on Monday. The precious metal extends its upside as the US Dollar remains on the back foot on growing expectations for a dovish Fed policy outlook next year.

Solana consolidates as spot ETF inflows near $1 billion signal institutional dip-buying

Solana price hovers above $131 at the time of writing on Monday, nearing the upper boundary of a falling wedge pattern, awaiting a decisive breakout. On the institutional side, demand for spot Solana Exchange-Traded Funds remained firm, pushing total assets under management to nearly $1 billion since launch. 

Big week ends with big doubts

The S&P 500 continued to push higher yesterday as the US 2-year yield wavered around the 3.50% mark following a Federal Reserve (Fed) rate cut earlier this week that was ultimately perceived as not that hawkish after all. The cut is especially boosting the non-tech pockets of the market.

Solana Price Forecast: SOL consolidates as spot ETF inflows near $1 billion signal institutional dip-buying

Solana (SOL) price hovers above $131 at the time of writing on Monday, nearing the upper boundary of a falling wedge pattern, awaiting a decisive breakout.