- Silver price remains sidelined after rising the most in a week, prods bearish chart formation on hourly play.
- Sustained trading beyond key HMAs, upbeat RSI favor XAG/USD buyers.
- Fortnight-old ascending support line acts as an extra filter towards the south.
- Silver buyer can aim for April 2022 peak on clear break of $25.15.
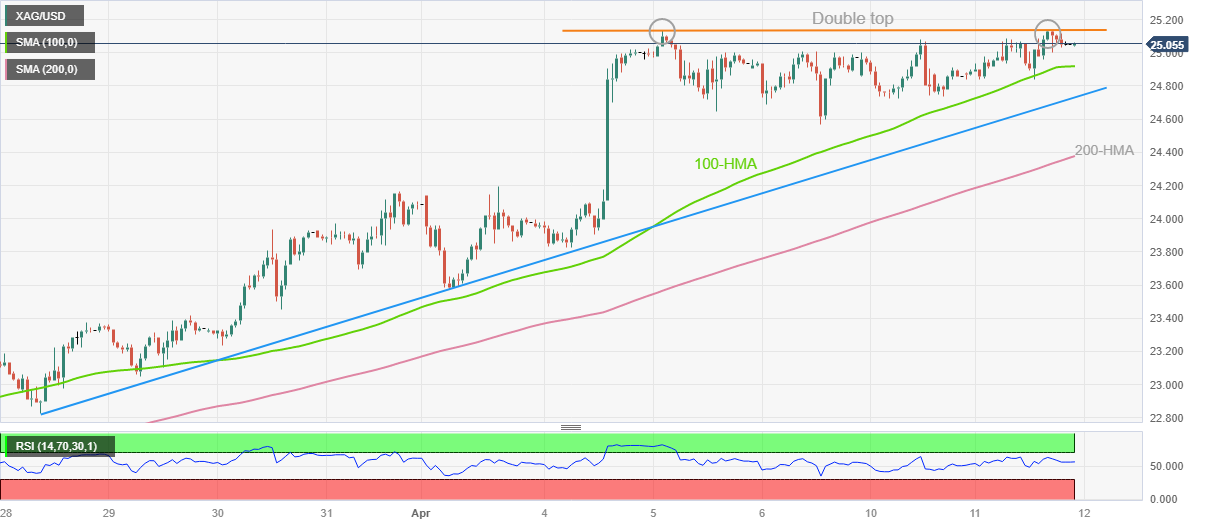
Silver price (XAG/USD) seesaws around $25.00 after posting the biggest daily gains in a week the previous day. In doing so, the bright metal braces to reject the “Double top” bearish chart formation on the hourly play.
It’s worth noting that the quote’s sustained trading above the 100 and 200 Hourly Moving Averages (HMAs) join firmer RSI (14), not overbought, to keep the Silver buyers hopeful of breaking the double tops near $25.15 and reject the bearish chart pattern.
Following that, a run-up toward April 2022 high near $26.25 can’t be ruled out. However, the RSI may turn overbought afterward and can prod the Silver buyers before they approach the previous yearly top surrounding $27.00.
Meanwhile, the 100-HMA and a two-week-old ascending trend line, respectively near $24.90 and $24.70, restrict the short-term downside of the XAG/USD price.
Should the quote breaks the $24.70, the previous Thursday’s low of $24.60 and the 200-HMA level of near $24.35 will be crucial as a break of which can direct Silver price toward the sub-$24.00 zone.
Overall, the Silver price is likely to remain firmer but the quote’s further upside hinges on a clear break of $25.15.
Silver price: Hourly chart
Trend: Further upside expected
Information on these pages contains forward-looking statements that involve risks and uncertainties. Markets and instruments profiled on this page are for informational purposes only and should not in any way come across as a recommendation to buy or sell in these assets. You should do your own thorough research before making any investment decisions. FXStreet does not in any way guarantee that this information is free from mistakes, errors, or material misstatements. It also does not guarantee that this information is of a timely nature. Investing in Open Markets involves a great deal of risk, including the loss of all or a portion of your investment, as well as emotional distress. All risks, losses and costs associated with investing, including total loss of principal, are your responsibility. The views and opinions expressed in this article are those of the authors and do not necessarily reflect the official policy or position of FXStreet nor its advertisers. The author will not be held responsible for information that is found at the end of links posted on this page.
If not otherwise explicitly mentioned in the body of the article, at the time of writing, the author has no position in any stock mentioned in this article and no business relationship with any company mentioned. The author has not received compensation for writing this article, other than from FXStreet.
FXStreet and the author do not provide personalized recommendations. The author makes no representations as to the accuracy, completeness, or suitability of this information. FXStreet and the author will not be liable for any errors, omissions or any losses, injuries or damages arising from this information and its display or use. Errors and omissions excepted.
The author and FXStreet are not registered investment advisors and nothing in this article is intended to be investment advice.


Recommended content
Editors’ Picks

EUR/USD extends gains toward 1.1400 after German sentiment data
EUR/USD stretches higher toward 1.1400 in the European session after upbeat German business sentiment data. The pair's solid uptick could also be linked to the latest leg down in the US Dollar as concerns re-emerge over Trump's tariff plans with China and Japan.

GBP/USD holds firm near 1.3300 on intense US Dollar weakness
GBP/USD rises further to test 1.3400 in European trading on Thursday, snapping a two-day losing streak. Uncertainty over US President Donald Trump's tariff plans returns and sends the US Dollar sharply lower across the board, suporting the pair. Mid-tier US data awaited.

Gold price retains intraday bullish bias amid softer USD, fading hopes for quick US-China trade deal
Gold price sticks to its positive bias through the early European session on Thursday and trades comfortably above the $3,300 mark. US Treasury Secretary Scott Bessent's remarks on Wednesday suggested that the current trade standoff between the US and China could continue for a while longer.

Bitcoin Price corrects as increased profit-taking offsets positive market sentiment
Bitcoin (BTC) is facing a slight correction, trading around $92,000 at the time of writing on Thursday after rallying 8.55% so far this week. Institutional demand remained strong as US spot Exchange Traded Funds (ETFs) recorded an inflow of $916.91 million on Wednesday.

Five fundamentals for the week: Traders confront the trade war, important surveys, key Fed speech Premium
Will the US strike a trade deal with Japan? That would be positive progress. However, recent developments are not that positive, and there's only one certainty: headlines will dominate markets. Fresh US economic data is also of interest.

The Best brokers to trade EUR/USD
SPONSORED Discover the top brokers for trading EUR/USD in 2025. Our list features brokers with competitive spreads, fast execution, and powerful platforms. Whether you're a beginner or an expert, find the right partner to navigate the dynamic Forex market.