Silver Price Analysis: Rising wedge teases XAG/USD bears around mid-$20.00s


  • Silver keeps pullback from six-week high inside a bearish chart pattern.
  • Higher low on RSI backs firmer prices to suggest short-term grind towards the north.
  • 200-SMA adds to the downside filters before directing sellers towards July’s low.

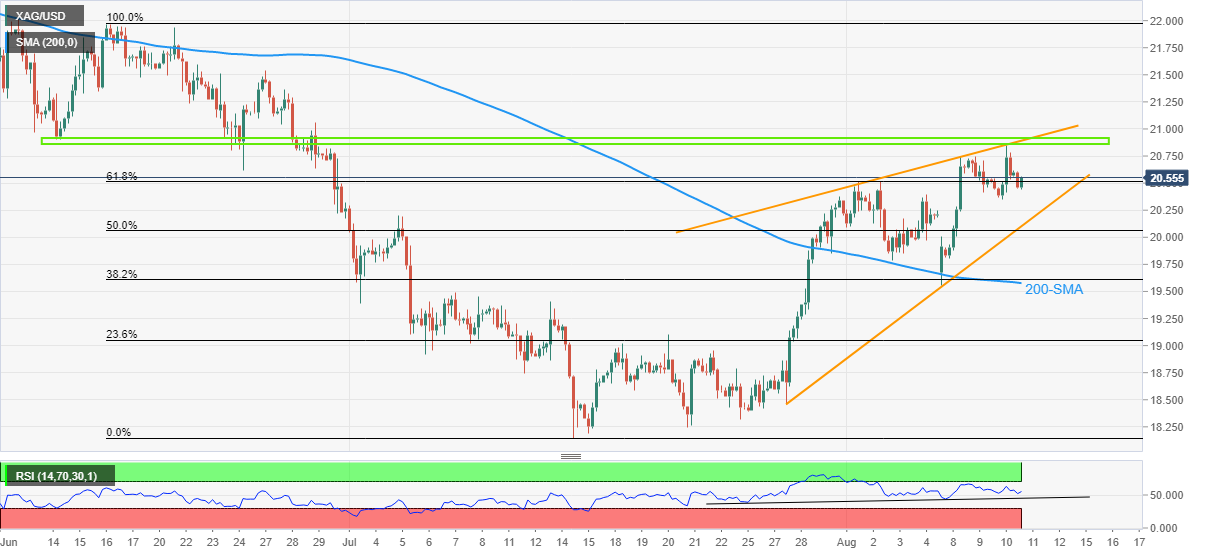
Silver price (XAG/USD) remains pressured at around $20.50, keeping the previous day’s pullback from the 1.5-month high marked the previous day. In doing so, the bright metal seesaws inside a fortnight-old rising wedge bearish chart pattern.

It should, however, be noted that the recent higher-low formation on prices gain support from the RSI (14), which in turn suggests a further grind of the quote towards the north.

However, a horizontal area comprising multiple levels marked since mid-June and the upper end of the rising wedge, around $20.85-90, appears a tough nut to crack for the XAG/USD bulls to crack.

Even if the bullion prices cross the $20.90 hurdle, the $21.00 round figure and late June swing high close to $21.55 should test the XAG/USD buyers before directing them to the six-week top surrounding $22.00.

Meanwhile, a downside break of the $20.10 will confirm the rising wedge, which in turn suggests the theoretical south-run towards $17.70.

It’s worth noting, however, that the convergence of the 200-SMA and a 38.2% Fibonacci retracement level of June-July downside, around $19.60-65, will precede the yearly bottom of $18.15 to challenge the metal bears.

XAG/USD: Four-hour chart

Trend: Limited upside expected

Additional important levels

Overview
Today last price 20.51
Today Daily Change -0.08
Today Daily Change % -0.39%
Today daily open 20.59
 
Trends
Daily SMA20 19.47
Daily SMA50 20.3
Daily SMA100 21.84
Daily SMA200 22.75
 
Levels
Previous Daily High 20.84
Previous Daily Low 20.35
Previous Weekly High 20.51
Previous Weekly Low 19.55
Previous Monthly High 20.37
Previous Monthly Low 18.15
Daily Fibonacci 38.2% 20.65
Daily Fibonacci 61.8% 20.54
Daily Pivot Point S1 20.34
Daily Pivot Point S2 20.1
Daily Pivot Point S3 19.85
Daily Pivot Point R1 20.84
Daily Pivot Point R2 21.09
Daily Pivot Point R3 21.33


Share: Feed news

Information on these pages contains forward-looking statements that involve risks and uncertainties. Markets and instruments profiled on this page are for informational purposes only and should not in any way come across as a recommendation to buy or sell in these assets. You should do your own thorough research before making any investment decisions. FXStreet does not in any way guarantee that this information is free from mistakes, errors, or material misstatements. It also does not guarantee that this information is of a timely nature. Investing in Open Markets involves a great deal of risk, including the loss of all or a portion of your investment, as well as emotional distress. All risks, losses and costs associated with investing, including total loss of principal, are your responsibility. The views and opinions expressed in this article are those of the authors and do not necessarily reflect the official policy or position of FXStreet nor its advertisers. The author will not be held responsible for information that is found at the end of links posted on this page.

If not otherwise explicitly mentioned in the body of the article, at the time of writing, the author has no position in any stock mentioned in this article and no business relationship with any company mentioned. The author has not received compensation for writing this article, other than from FXStreet.

FXStreet and the author do not provide personalized recommendations. The author makes no representations as to the accuracy, completeness, or suitability of this information. FXStreet and the author will not be liable for any errors, omissions or any losses, injuries or damages arising from this information and its display or use. Errors and omissions excepted.

The author and FXStreet are not registered investment advisors and nothing in this article is intended to be investment advice.

Recommended content


Recommended content

Editors’ Picks

EUR/USD stays in positive territory above 1.0850 after US data

EUR/USD stays in positive territory above 1.0850 after US data

EUR/USD clings to modest daily gains above 1.0850 in the second half of the day on Friday. The improving risk mood makes it difficult for the US Dollar to hold its ground after PCE inflation data, helping the pair edge higher ahead of the weekend.

EUR/USD News

GBP/USD stabilizes above 1.2850 as risk mood improves

GBP/USD stabilizes above 1.2850 as risk mood improves

GBP/USD maintains recovery momentum and fluctuates above 1.2850 in the American session on Friday. The positive shift seen in risk mood doesn't allow the US Dollar to preserve its strength and supports the pair.

GBP/USD News

Gold rebounds above $2,380 as US yields stretch lower

Gold rebounds above $2,380 as US yields stretch lower

Following a quiet European session, Gold gathers bullish momentum and trades decisively higher on the day above $2,380. The benchmark 10-year US Treasury bond yield loses more than 1% on the day after US PCE inflation data, fuelling XAU/USD's upside.

Gold News

Avalanche price sets for a rally following retest of key support level

Avalanche price sets for a rally following retest of  key support level

Avalanche (AVAX) price bounced off the $26.34 support level to trade at $27.95 as of Friday. Growing on-chain development activity indicates a potential bullish move in the coming days.

Read more

The election, Trump's Dollar policy, and the future of the Yen

The election, Trump's Dollar policy, and the future of the Yen

After an assassination attempt on former President Donald Trump and drop out of President Biden, Kamala Harris has been endorsed as the Democratic candidate to compete against Trump in the upcoming November US presidential election.

Read more

Forex MAJORS

Cryptocurrencies

Signatures