|

Silver Miners ETF (SIL) has turned higher

SIL (Silver Miners ETF) is a financial product designed to mirror the performance of silver mining companies. It offers investors a straightforward way to gain exposure to the silver market without directly purchasing physical silver or individual mining stocks. SIL diversifies risk by spreading investments across multiple companies within the sector, potentially providing a hedge against volatility in silver prices. In this article, we will look at the Elliott Wave outlook for the ETF.

SIL (Silver Miners ETF) monthly Elliott Wave chart

Chart

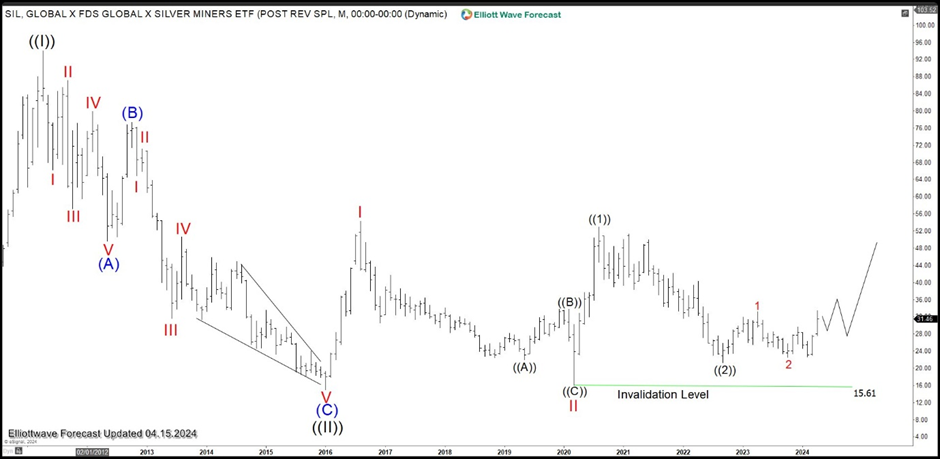
Monthly Elliott Wave chart of SIL above shows that wave ((II)) ended at 14.94. This completed the all-time correction in the ETF. From there, it has started to turn higher in a nesting impulse. Up from wave ((II)), wave I ended at 54.34 and dips in wave II ended at 15.61. Wave III higher is in progress as another impulse in lesser degree. Up from wave II, wave ((1)) ended at 52.87 and pullback in wave ((2)) ended at 21.26.  Near term, as far as pivot at 15.61 low stays intact, expect the ETF to extend higher.

Silver Miners ETF daily Elliott Wave chart

Chart

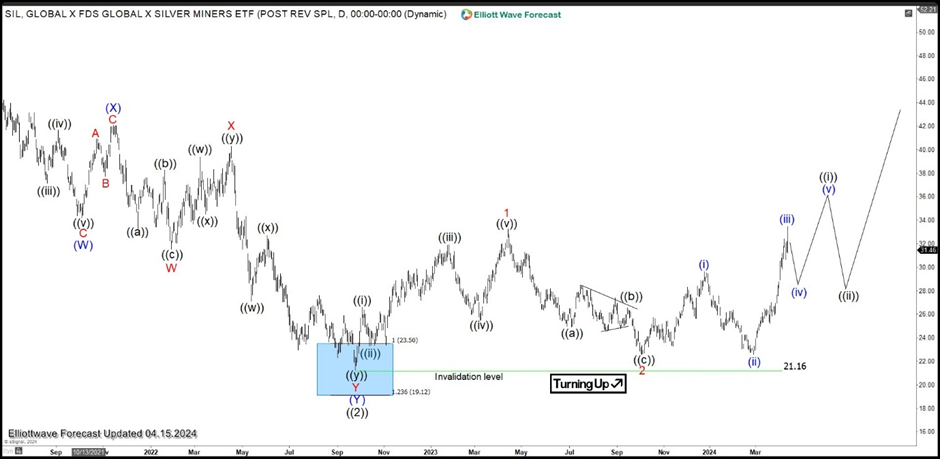
Daily Elliott Wave Chart of Silver Miners ETF (SIL) above shows that it has started the next leg higher after retesting 21.16 low. Up from wave ((2)) low at 21.16, wave 1 ended at 33.24 and dips in wave 2 ended at 22.57. The ETF has turned higher in wave 3. Up from 22.57 low, wave (i) ended at 29.61 and dips in wave (ii) ended at 22.58. Wave (iii) higher ended at 33.47. Near term, as far as pivot at 21.16 low stays intact, expect pullback to find support for further upside.

Author

Elliott Wave Forecast Team

Elliott Wave Forecast Team

ElliottWave-Forecast.com

More from Elliott Wave Forecast Team
Share:

Editor's Picks

EUR/USD trims gains, hovers around 1.1900 post-US data

EUR/USD trades slightly on the back foot around the 1.1900 region in a context dominated by the resurgence of some buying interest around the US Dollar on turnaround Tuesday. Looking at the US docket, Retail Sales disappointed expectations in December, while the ADP 4-Week Average came in at 6.5K.

GBP/USD comes under pressure near 1.3680

The better tone in the Greenback hurts the risk-linked complex on Tuesday, prompting GBP/USD to set aside two consecutive days of gains and trade slightly on the defensive below the 1.3700 mark. Investors, in the meantime, keep their attention on key UK data due later in the week.

Gold loses some traction, still above $5,000

Gold faces some selling pressure on Tuesday, surrendering part of its recent two-day advance although managing to keep the trade above the $5,000 mark per troy ounce. The daily pullback in the precious metal comes in response to the modest rebound in the US Dollar, while declining US Treasury yields across the curve seem to limit the downside.

XRP holds $1.40 amid ETF inflows and stable derivatives market

Ripple trades under pressure, with immediate support at $1.40 holding at the time of writing on Tuesday. A recovery attempt from last week’s sell-off to $1.12 stalled at $1.54 on Friday, leading to limited price action between the current support and the resistance.

Dollar drops and stocks rally: The week of reckoning for US economic data

Following a sizeable move lower in US technology Stocks last week, we have witnessed a meaningful recovery unfold. The USD Index is in a concerning position; the monthly price continues to hold the south channel support.

Bitcoin Cash trades lower, risks dead-cat bounce amid bearish signals

Bitcoin Cash (BCH) trades in the red below $522 at the time of writing on Tuesday, after multiple rejections at key resistance. BCH’s derivatives and on-chain indicators point to growing bearish sentiment and raise the risk of a dead-cat bounce toward lower support levels.