Siemens (SIE Stock) bullish bounce after bearish ABC pattern completed
-
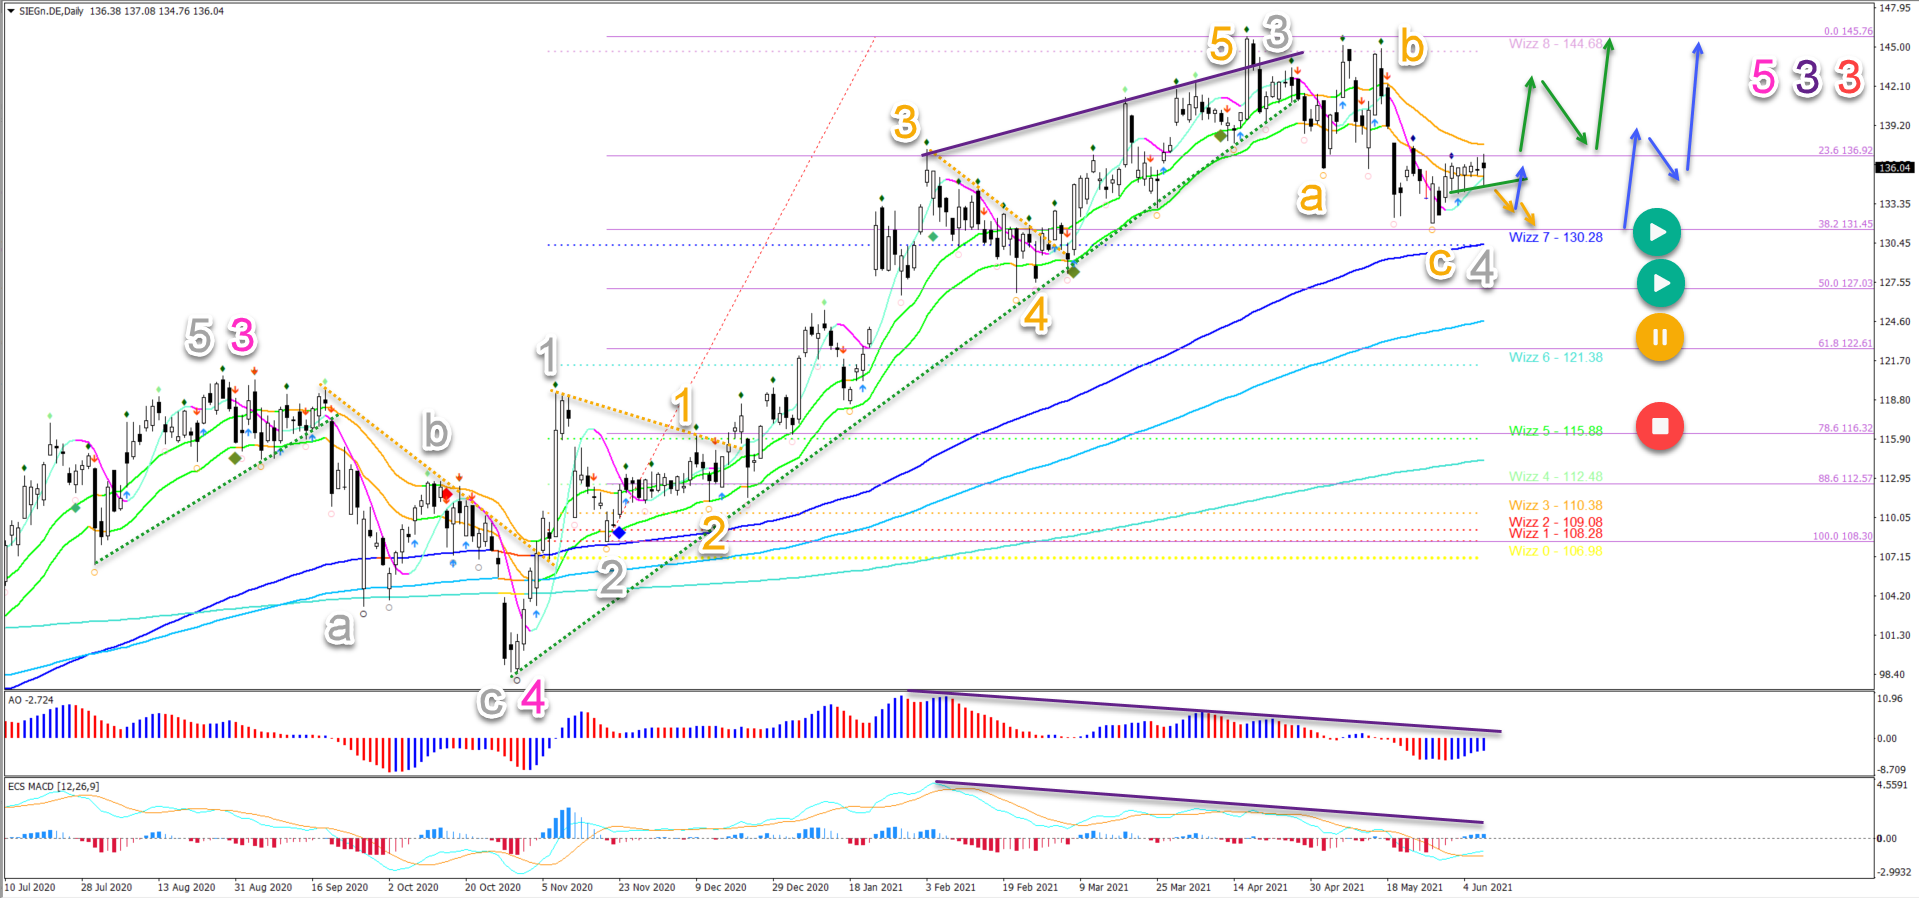
The overall uptrend, however, remains valid. The bounce at the 38.2% Fibonacci level suggests an Elliott Wave 4 pattern.
-
The current ABC pullback (orange) has probably completed a wave 4 (grey) at the 38.2% Fibonacci retracement level.
-
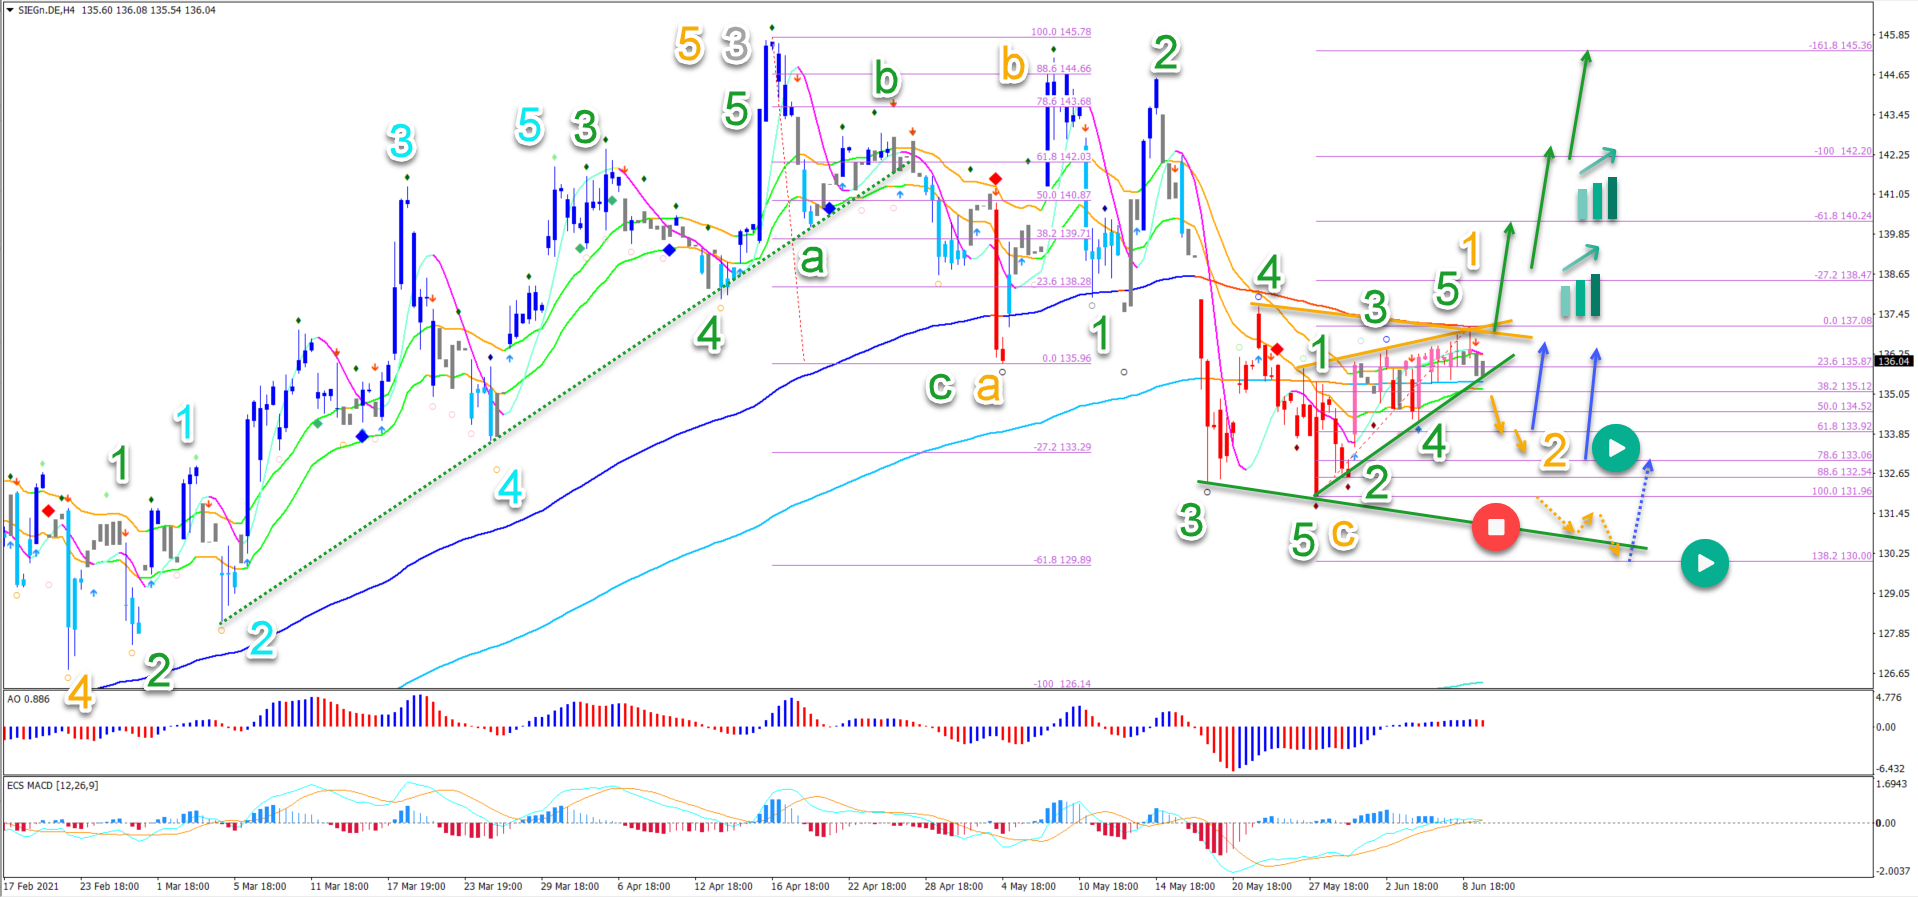
On the 4 hour chart, Siemens seems to have completed the 5 wave pattern in the wave C. A 5 wave leading diagonal seems to be unfolding in wave 1.

The Siemens (SIE) stock price made a bearish pullback after failing to break the top. Price action made an ABC pattern rather than full uptrend as our previous analysis expected.
Price charts and technical analysis
Siemens seems to have completed a bullish 5 waves (orange) in a wave 3 (grey) momentum:
-
The current ABC pullback (orange) has probably completed a wave 4 (grey) at the 38.2% Fibonacci retracement level.
-
The retracement in wave 4 is now a simple correction but it could expand into a longer ABC pattern as well.
-
A bullish breakout (green arrows) above the 21 ema zone could indicate a retest of the previous top. A bearish breakout (orange arrows) below the support trend line (green) could indicate a retest of the bottom or 38.2% Fibonacci level.
-
A bullish bounce is expected at the Fib level (blue arrows).
-
Only a deeper retracement below the 50% Fib places this wave outlook on hold (orange circle) or invalidates it (red circle).
On the 4 hour chart, Siemens seems to have completed the 5 wave pattern (green) in the wave C (orange):
-
A 5 wave leading diagonal (green) seems to be unfolding in wave 1 (orange).
-
A bearish ABC pattern could develop in wave 2 (orange).
-
The wave 2 is expected to bounce (blue arrows) at the Fibonacci levels.
-
A break below (dotted orange arrows) the 100% Fibonacci level indicates (red circle) one more lower low. It invalidates the wave 1-2 (orange) pattern.
-
But a bullish bounce is still expected at the Fibonacci levels around $140 (dotted blue arrow).
-
A bullish breakout (green arrows) before the pullback occurs indicate an immediate uptrend.
The analysis has been done with the ecs.SWAT method and ebook.
Premium
You have reached your limit of 3 free articles for this month.
Start your subscription and get access to all our original articles.
Author

Chris Svorcik
Elite CurrenSea
Experience Chris Svorcik has co-founded Elite CurrenSea in 2014 together with Nenad Kerkez, aka Tarantula FX. Chris is a technical analyst, wave analyst, trader, writer, educator, webinar speaker, and seminar speaker of the financial markets.


