Shanghai Composite Index Elliott Wave technical analysis [Video]
![Shanghai Composite Index Elliott Wave technical analysis [Video]](https://editorial.fxstreet.com/images/TechnicalAnalysis/ChartPatterns/PointFigure/hand-of-business-man-write-a-business-graph-59591884_XtraLarge.jpg)
Shanghai Composite Elliott Wave technical analysis
-
Function: Counter Trend.
-
Mode: Corrective.
-
Structure: Orange wave 2.
-
Position: Navy blue wave 3.
-
Next higher degree: Orange wave 3.
Details
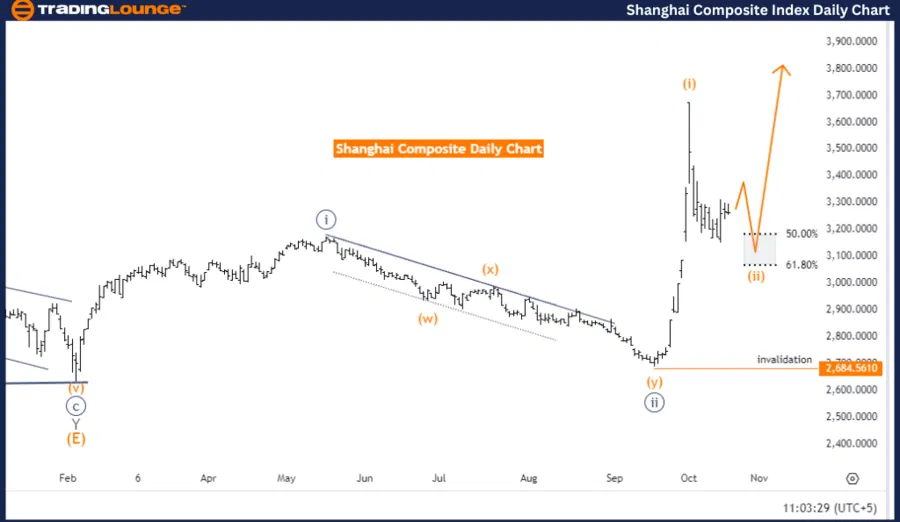
The Elliott Wave analysis for the Shanghai Composite on the daily chart highlights a counter-trend phase in a corrective mode. The current structure is orange wave 2, which follows the completion of orange wave 1. The market is positioned in navy blue wave 3, indicating that the corrective phase is still unfolding.
With orange wave 1 completed, orange wave 2 is now developing as a retracement within the broader trend. Once orange wave 2 finishes, the next move is expected to be orange wave 3, signaling the resumption of the overall upward movement.
The higher-degree focus remains on the upcoming orange wave 3, which is expected to follow once the corrective phase completes. Prices may experience fluctuations during orange wave 2, as this wave represents a temporary pause or reversal before the continuation of the larger trend.
- Wave cancellation level: 2684.5610 – If prices fall below this level, the current wave count would be invalidated, and a reassessment of the wave structure would be required.
Summary
The Shanghai Composite daily chart is currently in a corrective phase within orange wave 2, following the completion of orange wave 1. The market is positioned within navy blue wave 3, with an anticipated upward movement in orange wave 3 once the correction concludes. The key level to watch is 2684.5610, as a breach of this level would invalidate the current wave count.
Shanghai Composite Elliott Wave daily chart
Shanghai Composite Elliott Wave technical analysis
- Function: Counter Trend
- Mode: Corrective
- Structure: Orange wave 2
- Position: Navy blue wave 3
- Next Higher Degree: Orange wave 3
Details
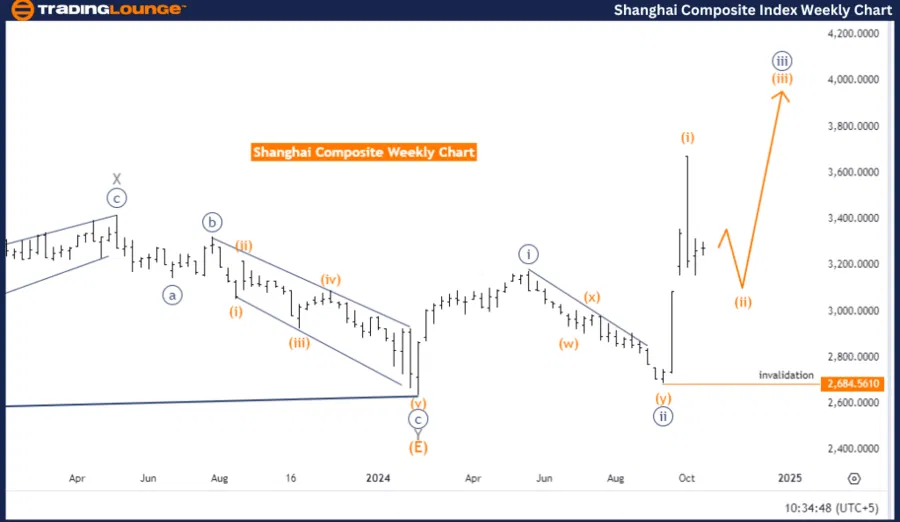
The Elliott Wave analysis for the Shanghai Composite on the weekly chart reveals a counter-trend movement in a corrective mode. The market is currently unfolding in orange wave 2, following the completion of orange wave 1. This corrective phase indicates a temporary price retracement within the broader upward trend.
The market is positioned in navy blue wave 3, which suggests that after the completion of orange wave 2, a future upward movement is expected, as orange wave 3 begins. This corrective wave allows the market to pause and adjust before the larger upward trend continues.
The higher degree points toward the forthcoming orange wave 3, expected to resume the upward momentum once the current correction in orange wave 2 concludes.
- Wave cancellation level: 2684.5610 – If the price drops below this level, the current wave count would be invalidated, requiring a reevaluation of the analysis.
Summary
The Shanghai Composite weekly chart is currently in a corrective phase within orange wave 2, following the completion of orange wave 1. The market is positioned in navy blue wave 3, and an upward movement in orange wave 3 is expected once the correction finishes. The key level to watch is 2684.5610, which, if breached, would invalidate the current wave count.
Shanghai Composite Elliott Wave weekly chart
Shanghai Composite Index Elliott Wave technical analysis [Video]
Author

Peter Mathers
TradingLounge
Peter Mathers started actively trading in 1982. He began his career at Hoei and Shoin, a Japanese futures trading company.


