Shanghai Composite Elliott Wave technical analysis [Video]
![Shanghai Composite Elliott Wave technical analysis [Video]](https://editorial.fxstreet.com/images/TechnicalAnalysis/ChartPatterns/Candlesticks/high-resolution-stock-exchange-evolution-panel-55741922_XtraLarge.jpg)
Shanghai Composite Elliott Wave Analysis Trading Lounge.
Shanghai Composite Elliott Wave technical analysis
Function: Counter Trend.
Mode: Impulsive as C.
Structure: Gray Wave C.
Position: Orange Wave 2.
Direction (next higher degrees): Orange Wave 3.
Details: Gray wave B appears completed, with gray wave C now active.
Wave invalid level: 2684.5610.
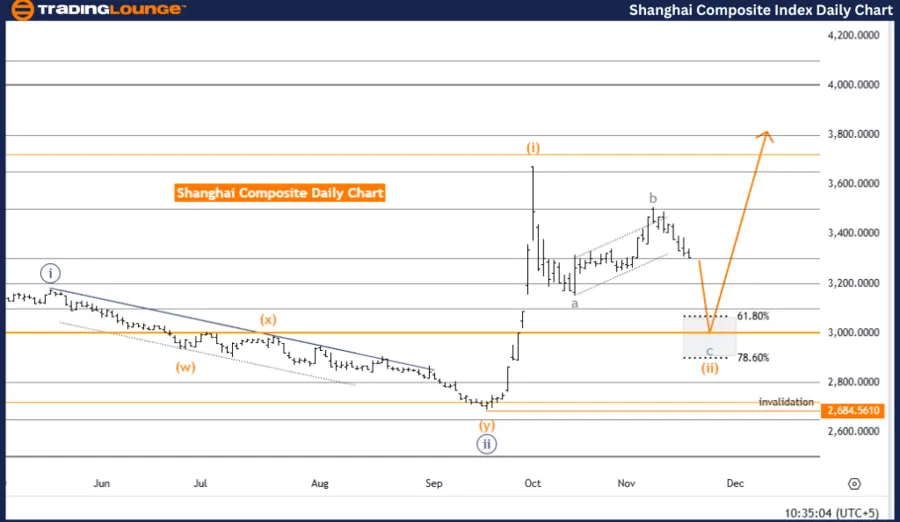
The Shanghai Composite daily chart analysis by Trading Lounge highlights a counter-trend phase within an Elliott Wave structure. The active wave is identified as gray wave C, positioned within orange wave 2, signifying the continuation of the corrective movement. The completion of gray wave B has set the stage for gray wave C, marking the next segment of the counter-trend correction.
In Elliott Wave theory, wave C in a corrective structure typically represents a decisive phase, aiming to finalize the correction before the trend potentially resumes or reverses. The ongoing gray wave C aligns with this concept, reflecting a corrective pattern within the broader orange wave 2 framework.
The analysis identifies a key invalidation level at 2684.5610. Should the price fall to or below this level, the existing wave structure would be invalidated, signaling a potential deviation from the expected pattern. Monitoring this threshold is essential for traders, as it serves as a benchmark for validating the current corrective phase and maintaining alignment with the anticipated wave structure.
Summary
The Shanghai Composite daily chart depicts a counter-trend correction driven by gray wave C within orange wave 2. The completion of gray wave B has initiated this phase, suggesting further movement consistent with the wave C pattern.
Traders should closely monitor the invalidation level at 2684.5610, as a breach would challenge the current wave structure and indicate potential adjustments to the corrective outlook. This level is critical for confirming the accuracy of the Elliott Wave analysis and guiding decisions within the ongoing counter-trend phase.
Shanghai Composite Elliott Wave Analysis Trading Lounge Weekly Chart
Shanghai Composite Elliott Wave technical analysis
Function: Counter Trend
Mode: Corrective
Structure: Orange Wave 2
Position: Navy Blue Wave 3
Direction (next higher degrees): Orange Wave 3
Details: Orange wave 1 appears completed, with orange wave 2 now active.
Wave invalid level: 2684.5610
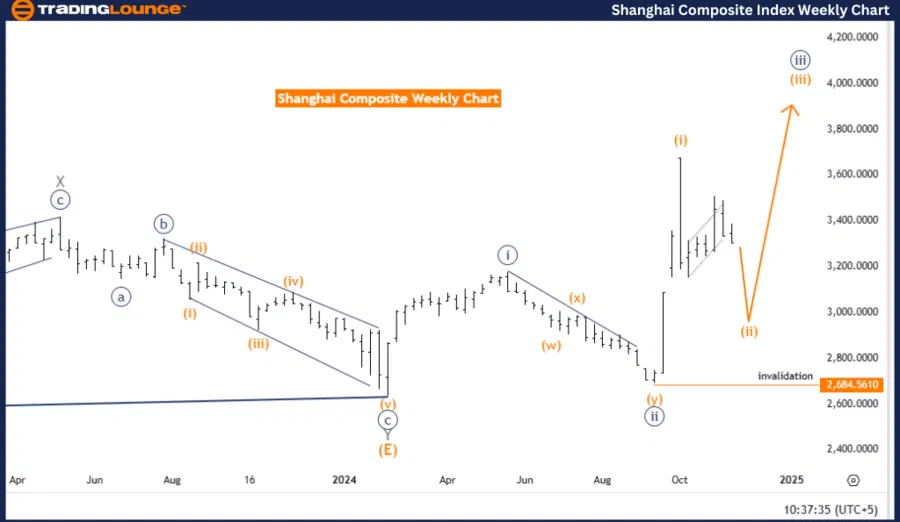
The Shanghai Composite weekly chart analysis by Trading Lounge outlines a counter-trend corrective phase within the Elliott Wave framework. The active wave structure is orange wave 2, situated within navy blue wave 3, signaling a temporary pullback within a larger bullish trend. The completion of orange wave 1 has set the stage for orange wave 2, representing the ongoing correction phase.
In Elliott Wave theory, wave 2 typically exhibits a corrective nature, retracing part of wave 1 before the trend resumes. The current development of orange wave 2 reflects this characteristic, potentially paving the way for a continuation toward orange wave 3 once the pullback concludes.
The analysis underscores an invalidation level at 2684.5610. If the price drops to or below this level, the current wave structure will be invalidated, suggesting a departure from the expected corrective pattern. This threshold is essential for traders to observe as it verifies the validity of the wave structure and the broader market trend.
Summary
The Shanghai Composite weekly chart highlights a counter-trend corrective phase, with orange wave 2 active within navy blue wave 3. The conclusion of orange wave 1 initiated this pullback, aligning with the characteristics of wave 2 in the Elliott Wave sequence.
Traders should carefully monitor the invalidation level at 2684.5610, as a breach would challenge the current wave structure and indicate potential changes to the corrective outlook. This level is vital for maintaining alignment with the projected wave structure and devising effective trading strategies.
Shanghai Composite Elliott Wave technical analysis [Video]
Author

Peter Mathers
TradingLounge
Peter Mathers started actively trading in 1982. He began his career at Hoei and Shoin, a Japanese futures trading company.


