ASX: SCG Elliott Wave technical analysis
Our Elliott Wave analysis today provides an update on the Australian Stock Exchange (ASX) focusing on SCENTRE GROUP – SCG.
We foresee upside potential for ASX:SCG in the near term. The short-term outlook emphasizes waiting for a pullback within the second wave and, based on that, identifying high-quality long trade setups. This analysis guides you on when to stay out, when to enter positions, and how to approach trading scientifically and intuitively.
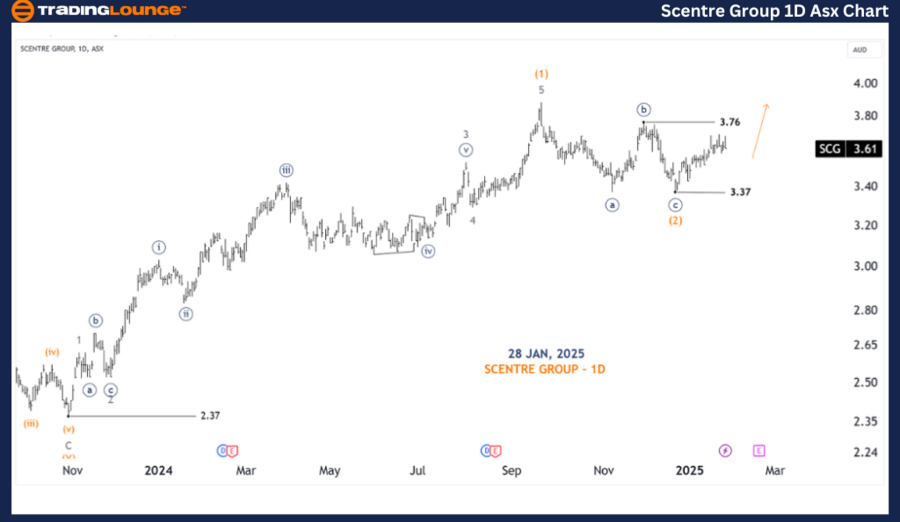
One-day chart (semilog scale) analysis
-
Function: Major Trend (Intermediate degree, orange).
-
Mode: Motive.
-
Structure: Impulse.
-
Position: Wave (3) - orange.
-
Details: Wave (2) - orange appears to have ended as a Zigzag at the low near 3.37, and upside potential is developing with Wave (3) - orange. Specifically, this is an Extended Wave, and we are currently in Wave 1 - grey.
-
Invalidation Point: 3.37.
ASX: SCG Elliott Wave technical analysis
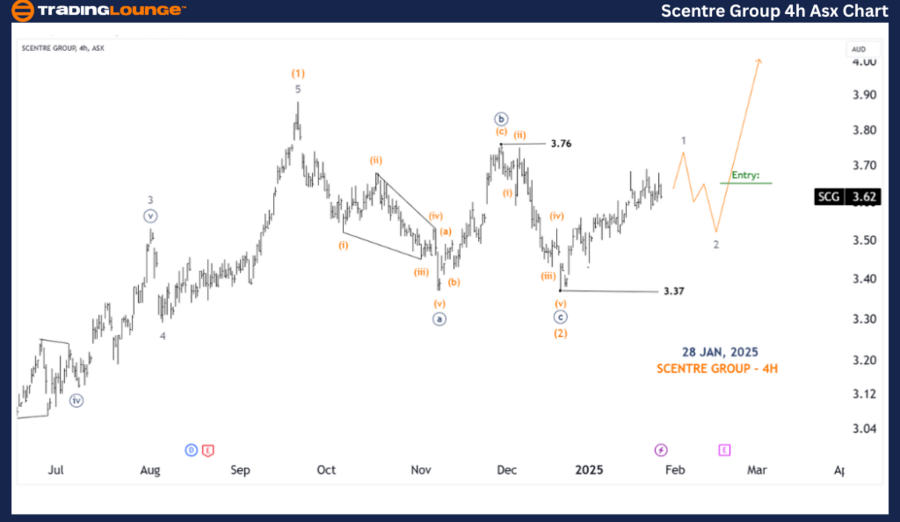
Four-hour chart analysis
-
Function: Major Trend (Minute degree, navy).
-
Mode: Motive.
-
Structure: Impulse.
-
Position: Wave 1 - grey of Wave (3) - orange.
-
Details: The shorter-term outlook indicates that Wave 1 - grey of Wave (3) - orange is nearing completion. A decline with Wave 2 - grey is anticipated shortly, which offers a key opportunity to identify Long Trade Setups.
-
Invalidation point: 3.37.
-
Key point: Wave b of Wave 2 - grey.
Conclusion
Our analysis and forecast for ASX: SCENTRE GROUP – SCG focus on contextual trends and short-term outlooks, offering insights into current market movements and strategies to capitalize on them effectively. We provide specific price points as validation or invalidation signals for our wave count, enhancing confidence in our perspective. By combining these elements, we deliver an objective and professional outlook on market trends.
Scentre Group Elliott Wave technical forecast [Video]
As with any investment opportunity there is a risk of making losses on investments that Trading Lounge expresses opinions on.
Historical results are no guarantee of future returns. Some investments are inherently riskier than others. At worst, you could lose your entire investment. TradingLounge™ uses a range of technical analysis tools, software and basic fundamental analysis as well as economic forecasts aimed at minimizing the potential for loss.
The advice we provide through our TradingLounge™ websites and our TradingLounge™ Membership has been prepared without considering your objectives, financial situation or needs. Reliance on such advice, information or data is at your own risk. The decision to trade and the method of trading is for you alone to decide. This information is of a general nature only, so you should, before acting upon any of the information or advice provided by us, consider the appropriateness of the advice considering your own objectives, financial situation or needs. Therefore, you should consult your financial advisor or accountant to determine whether trading in securities and derivatives products is appropriate for you considering your financial circumstances.
Recommended content
Editors’ Picks
EUR/USD regains traction and bounces off daily lows
After bottoming out near 1.0450, EUR/USD managed to regain some balance and revisit the 1.0470 zone on the back of alternating risk appetite trends in the FX world and amid investors' assessment of the German elections.
GBP/USD hovers around 1.2630 amid a vacillating Dollar
GBP/USD alternates gains with losses in the low-1.2600s in response to the lack of a clear direction in the global markets and a lacklustre price action surrounding the Greenback.
Gold extends consolidative phase near record highs
Prices of Gold glimmered higher on Monday, hitting an all-time high around $2,955 per ounce troy on the back of the US Dollar's inconclusive price action as investors are warming up for a key inflation report due toward the end of the week.
Bitcoin Price Forecast: BTC standoff continues
Bitcoin has been consolidating between $94,000 and $100,000 since early February. Amid this consolidation, investor sentiment remains indecisive, with US spot ETFs recording a $540 million net outflow last week, signaling institutional demand weakness.
Money market outlook 2025: Trends and dynamics in the Eurozone, US, and UK
We delve into the world of money market funds. Distinct dynamics are at play in the US, eurozone, and UK. In the US, repo rates are more attractive, and bills are expected to appreciate. It's also worth noting that the Fed might cut rates more than anticipated, similar to the UK. In the eurozone, unsecured rates remain elevated.
The Best brokers to trade EUR/USD
SPONSORED Discover the top brokers for trading EUR/USD in 2025. Our list features brokers with competitive spreads, fast execution, and powerful platforms. Whether you're a beginner or an expert, find the right partner to navigate the dynamic Forex market.