SBIN Elliott Wave technical analysis [Video]
![SBIN Elliott Wave technical analysis [Video]](https://editorial.fxstreet.com/images/Markets/Equities/Industries/RealEstateStocks/pic-house-for-sale-637435365694765834_XtraLarge.jpg)
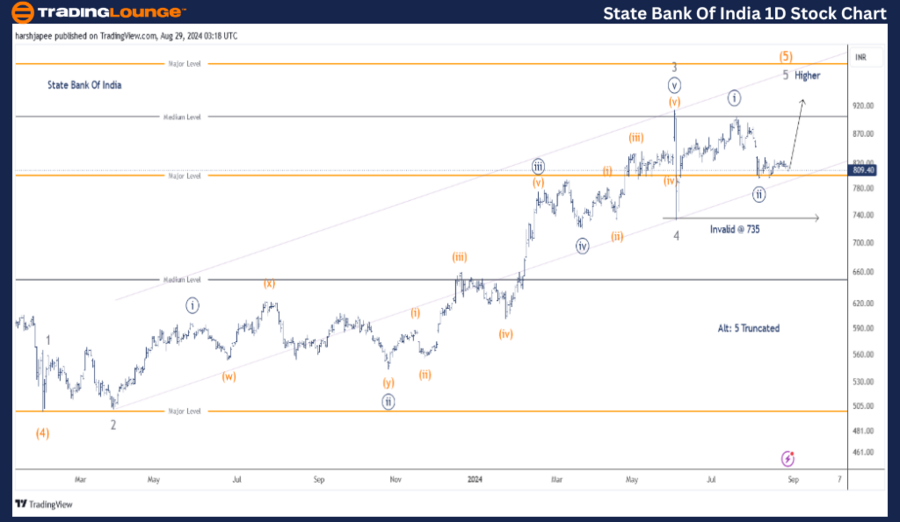
STATE BANK OF INDIA – SBIN (1D Chart) Elliott Wave technical analysis
Function: Larger Degree Trend Higher (Intermediate degree, orange).
Mode: Motive.
Structure: Impulse.
Position: Minute Wave ((ii)).
Details: Minute Wave ((ii)) Navy is complete around 810. If correct, prices should turn higher as Minute Wave ((iii)) Navy begins to unfold within Minor Wave 5 Grey of Intermediate Wave (5) Orange. Alternatively, Minor Wave 5 Grey terminated as truncation below 920.
Invalidation point: 735.
State Bank of India Daily Chart Technical Analysis and potential Elliott Wave Counts:
State Bank of India daily chart is suggesting a continued push higher above 920 levels as Minute Wave ((iii)) begins to unfold within Minor Wave 5 Grey to terminate Intermediate Wave (5) Orange going forward. If correct, interim low around 800 levels will hold.
The stock has been rising since February 2023 after terminating Intermediate Wave (4) around 500 mark. Looking at the sub waves, Minor Waves 1, 2, 3 and 4 are complete as labelled and Wave 5 Grey is unfolding against 735.
Ideally, if the larger degree trend remains intact, prices should hold above 735 and produce a potential impulse to complete Minor Wave 5 Grey. Alternatively, Wave 5 Grey was truncated and complete around 920 highs.
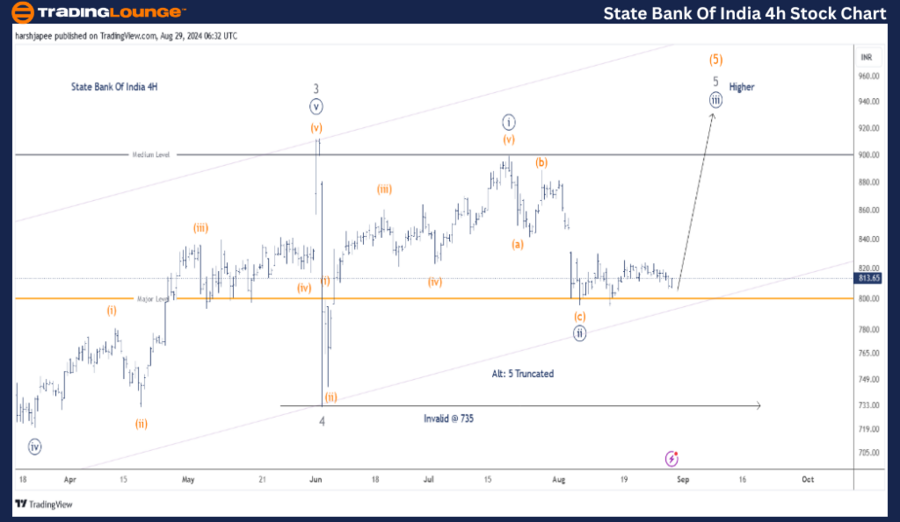
STATE BANK OF INDIA – SBIN (4H Chart) Elliott Wave/technical analysis
Function: Larger Degree Trend Higher (Intermediate degree, orange).
Mode: Motive.
Structure: Impulse.
Position: Minute Wave ((ii)).
Details: Minute Wave ((ii)) Navy is complete around 810. If correct, prices should turn higher as Minute Wave ((iii)) Navy begins to unfold within Minor Wave 5 Grey of
Intermediate Wave (5) Orange. Alternatively, Minor Wave 5 Grey terminated as truncation below 920. In that scenario, the stock should continue lower to produce an impulse wave.
Invalidation point: 735.
State Bank of India 4H Chart Technical Analysis and potential Elliott Wave Counts:
State Bank of India 4H chart shows a closer look within Minute Wave ((i)) and ((ii)) Navy since Minor Wave 4 terminated around 735 mark. The stock has produced an impulse (Minuette waves (i) through (v) orange) between 735 and 920 terminating Minute Wave ((i)).
Furthermore Minute Wave (ii)) has produced a Zigzag. If the above is correct, Minute Wave ((iii)) should be underway soon against 735 mark.
Conclusion
State Bank of India is progressing higher and likely to print above 920 as Minute Wave ((iii)) progresses within Intermediate Wave (5) Orange. A break below 735 would indicate that alternate scenario is coming into play.
Technical analyst: Harsh Japee.
STATE BANK OF INDIA – SBIN (1D Chart) Elliott Wave technical analysis [Video]
Author

Peter Mathers
TradingLounge
Peter Mathers started actively trading in 1982. He began his career at Hoei and Shoin, a Japanese futures trading company.


