SBI Life Insurance Co Elliott Wave technical analysis [Video]
![SBI Life Insurance Co Elliott Wave technical analysis [Video]](https://editorial.fxstreet.com/images/TechnicalAnalysis/ChartPatterns/PointFigure/businessman-17823255_XtraLarge.jpg)
SBILIFE Elliott Wave technical analysis
Function: Larger Degree Trend Higher (Intermediate degree, orange).
Mode: Motive.
Structure: Impulse.
Position: Minute Wave ((v)) Navy.
Details: Minute Wave ((v)) looks complete around 1940 or could be soon terminating within Minor Wave 5 Grey of Intermediate Wave (5) Orange. Traders are advised to book profits here as prices have turned lower.
Invalidation point: 1667.
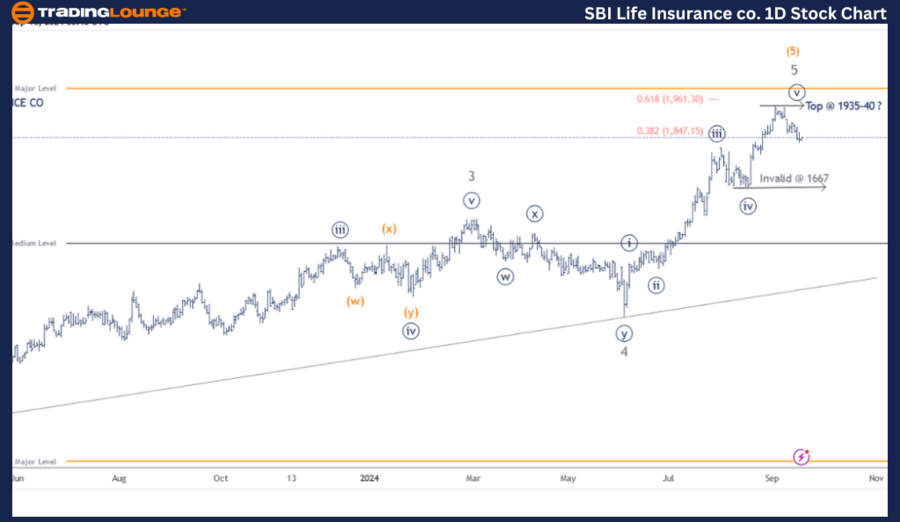
SBI Life Insurance Co daily chart technical analysis and potential Elliott Wave counts
SBI Life Insurance Co daily chart indicates a progressive impulse wave higher between March 2023 and now as prices hit 1935-40 highs. Probability remains high for the fifth to have terminated at multiple degrees here. If correct, expect a larger degree corrective wave to begin soon against 1940.
The stock terminated Intermediate Wave (4) Orange around 1060-65 range in March 2023. Since then, prices have rallied through 1935-40 highs, sub dividing into five waves. Please note that Minute Wave ((v)) of Minor Wave 5 Grey could be complete or near to completion around 1960-65.
The fibonacci 0.618 extension of Wave 1 through 3 was missed by a small margin and bulls could attempt another push through. Alternatively, a slip through 1667 would confirm a top is in place and bears are back in control.
SBILIFE Elliott Wave technical analysis
Function: Larger Degree Trend Higher (Intermediate degree, orange).
Mode: Motive.
Structure: Impulse.
Position: Minute Wave ((v)) Navy.
Details: Minute Wave ((v)) looks complete around 1940 or could be soon terminating within Minor Wave 5 Grey of Intermediate Wave (5) Orange. The sub waves within Wave ((v)) are not clear yet and prices could print a shallow high through 1960 before reversing.
Invalidation point: 1667.
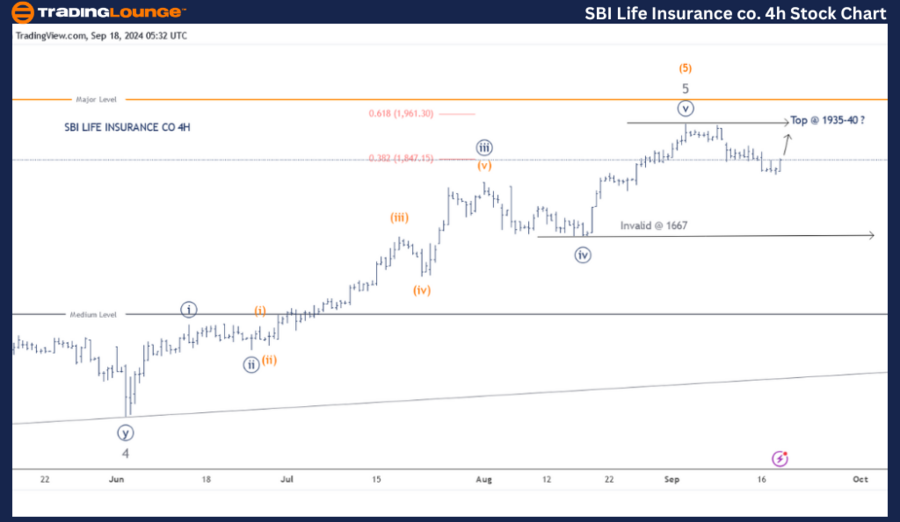
SBI Life Insurance Co four-our chart technical analysis and potential Elliott Wave counts
SBI Life Insurance Co 4H chart highlight sub waves after Minor Wave 4 Grey completed around 1311 on June 04, 2024 alongside most stocks. Minute Wave ((iii)) was extended and Wave ((iv)) a flat. The sub waves with Minute Wave ((v)) are not very clear and possibility remain for a re-test of 1940. The key level is 1667 though.
Conclusion
SBI Life Insurance Co might have completed its Intermediate Wave (5) Orange around 1935-40 range or could be near to termination. A break below 1667 will confirm.
SBI Life Insurance Co Elliott Wave technical analysis [Video]
Author

Peter Mathers
TradingLounge
Peter Mathers started actively trading in 1982. He began his career at Hoei and Shoin, a Japanese futures trading company.


